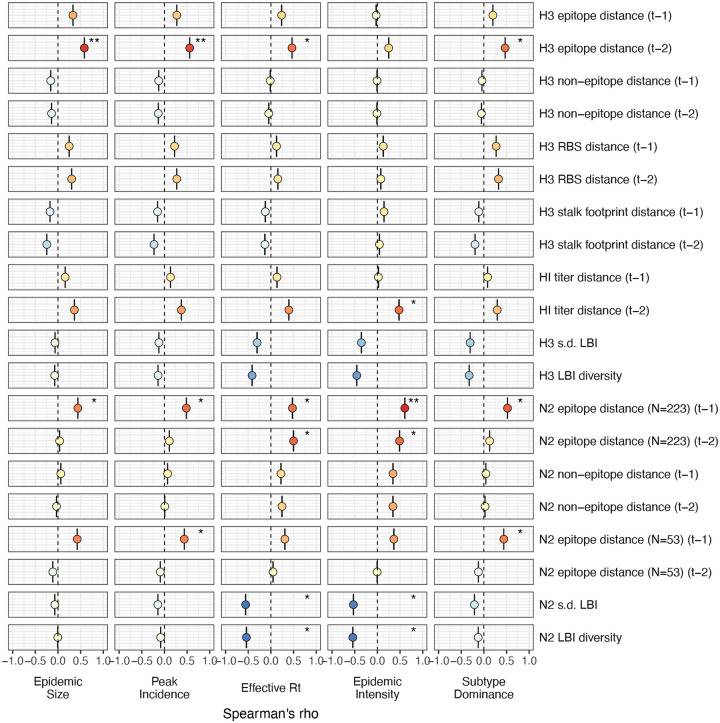
Figure 3 – figure supplement 1. Univariate correlations between influenza A(H3N2) evolutionary indictors and epidemic impact.
Mean Spearman’s rank correlation coefficients, 95% confidence intervals of correlation coefficients, and corresponding p-values of bootstrapped (N = 1000) evolutionary indicators (rows) and epidemic metrics (columns). Point color indicates the strength and direction of the association, from dark red (strong positive correlation) to dark blue (strong negative correlation), and stars indicate statistical significance (* P < 0.05, ** P < 0.01, *** P < 0.001). Abbreviations: t − 1 = one-season lag, t − 2 = two-season lag, RBS: receptor binding site, HI = hemagglutination inhibition, s.d. = standard deviation, LBI = local branching index.

