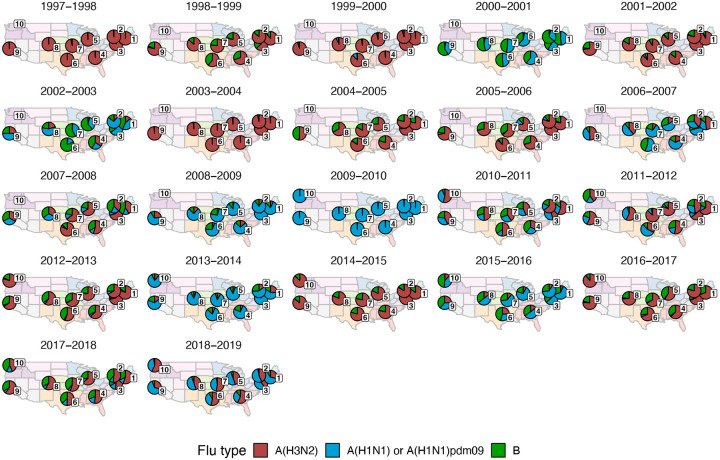
Figure 4 – figure supplement 1. Regional patterns of influenza type and subtype circulation during seasons 1997–1998 to 2018–2019.
Pie charts represent the proportion of influenza positive samples that were typed as A(H3N2), A(H1N1) or A(H1N1)pdm09, and B in each HHS region. Data for Region 10 (purple) are not available for seasons prior to 2009.

