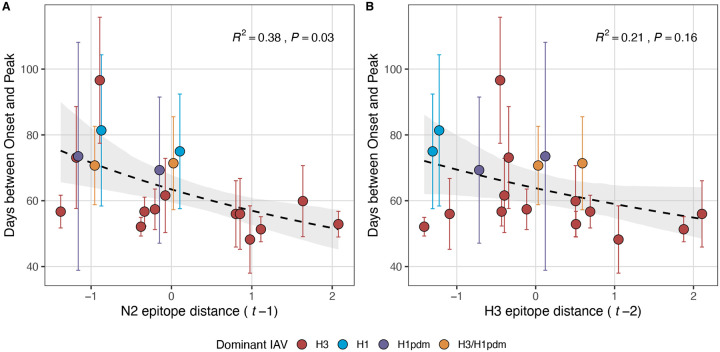
Figure 5 – figure supplement 2. Epidemic speed increases with N2 antigenic drift.
N2 epitope distance significantly correlates with fewer days from epidemic onset to peak (A), while the relationship between H3 epitope distance and epidemic speed is weaker (B). Seasonal epitope distance is the mean distance between strains circulating in season t and those circulating in the prior season (t − 1) or two seasons ago (t − 2). Distances are scaled to aid in direct comparison of evolutionary indicators. Point color indicates the dominant influenza A subtype based on CDC influenza season summary reports (red: A(H3N2), blue: A(H1N1), purple: A(H1N1)pdm09, orange: A(H3N2)/A(H1N1)pdm09 co-dominant). The seasonal mean number of days from onset to peak was fit as a function of H3 or N2 epitope distance using Gamma GLMs (inverse link) with 1000 bootstrap resamples.

