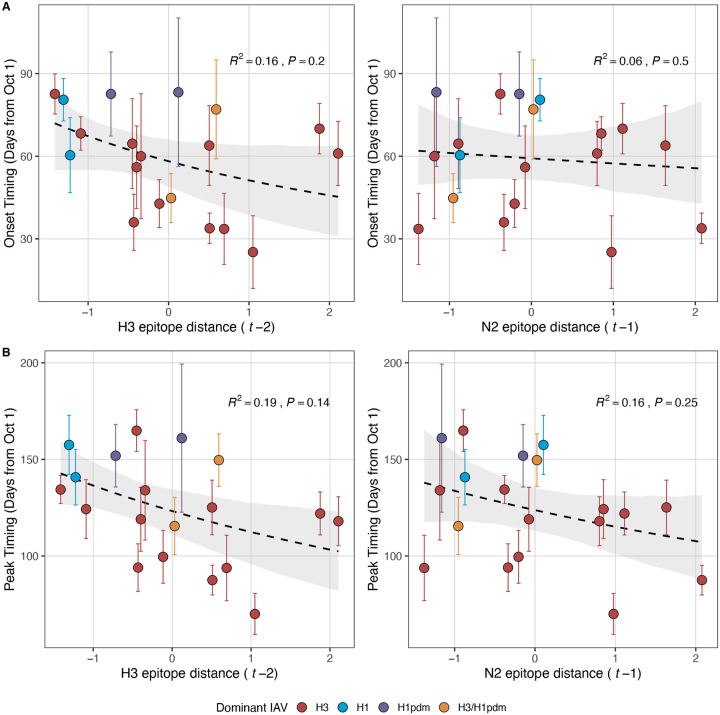
Figure 5 – figure supplement 3. Influenza A(H3N2) epidemic onsets and peaks are earlier in seasons with high antigenic novelty, but correlations are not statistically significant.
A. Epidemic onsets are earlier in seasons with increased H3 epitope distance (t − 2), but the correlation is not statistically significant. B. Epidemic peaks are earlier in seasons with increased H3 epitope distance (t − 2) and N2 epitope distance (t − 1), but correlations are not statistically significant. Seasonal epitope distance is the mean distance between strains circulating in season t and those circulating in the prior season (t − 1) or two seasons ago (t − 2). Distances are scaled to aid in direct comparison of evolutionary indicators. Point color indicates the dominant influenza A subtype based on CDC influenza season summary reports (red: A(H3N2), blue: A(H1N1), purple: A(H1N1)pdm09, orange: A(H3N2)/A(H1N1)pdm09 co-dominant). Seasonal mean epidemic onsets and peaks were fit as a function of H3 or N2 epitope distance using Gaussian GLMs (inverse link) with 1000 bootstrap resamples.

