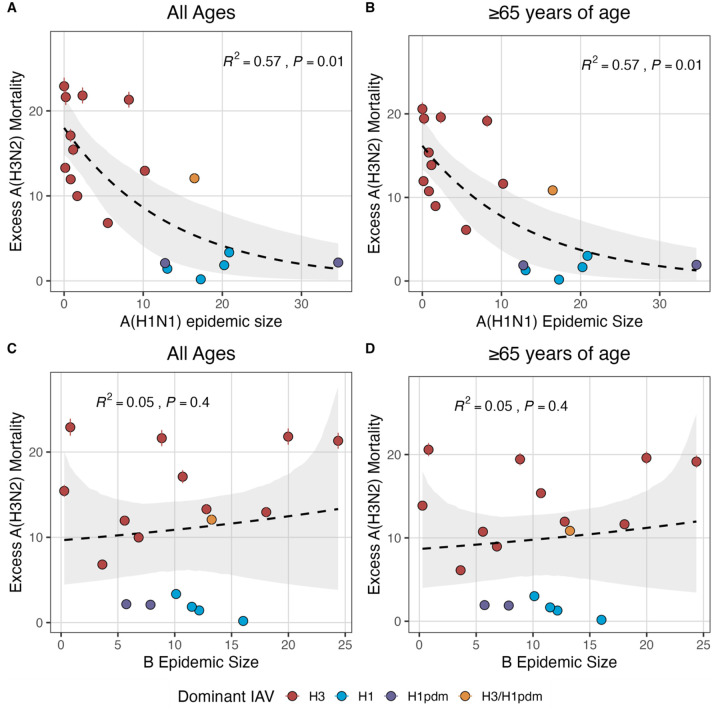
Figure 7 – figure supplement 1. National excess influenza A(H3N2) mortality decreases with A(H1N1) epidemic size but not B epidemic size.
Excess influenza deaths attributable to A(H3N2) (per 100,000 people) were estimated from a seasonal regression model fit to weekly pneumonia and influenza-coded deaths. Point color indicates the dominant influenza A subtype based on CDC influenza season summary reports (red: A(H3N2), blue: A(H1N1), purple: A(H1N1)pdm09, orange: A(H3N2)/A(H1N1)pdm09 co-dominant), and vertical bands are 95% confidence intervals of model estimates. Seasonal national excess mortality estimates were fit as a function of A(H1N1) or B epidemic size using Gaussian GLMs (log link) with 1000 bootstrap resamples.

