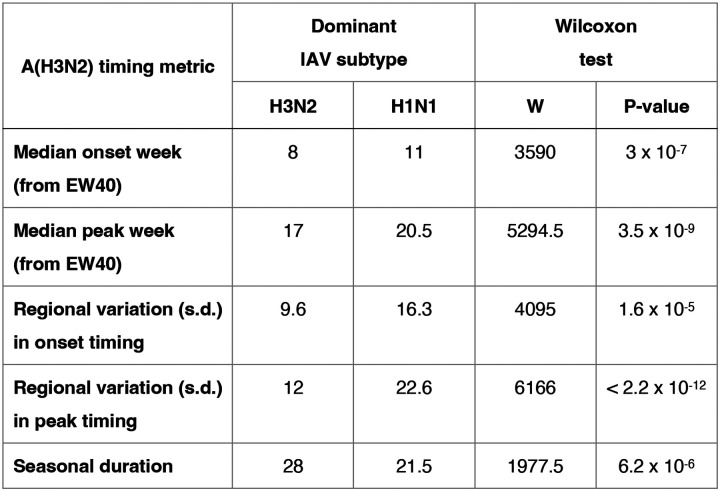
Figure 7 – table supplement 1. Comparison of influenza A(H3N2) epidemic timing between A(H3N2) and A(H1N1) dominant seasons.
We defined influenza A virus (IAV) subtype dominance in each season based on the proportion of IAV positive samples typed as A(H3N2). We categorized seasons as A(H3N2) or A(H1N1) dominant when ≥ 70% of IAV positive samples were typed as one IAV subtype. We used two-sided Wilcoxon rank-sum tests to compare the distributions of epidemic timing metrics between A(H3N2) and A(H1N1) dominant seasons. Abbreviations: EW40 = epidemic week 40 (the start of the influenza season); s.d. = standard deviation.

