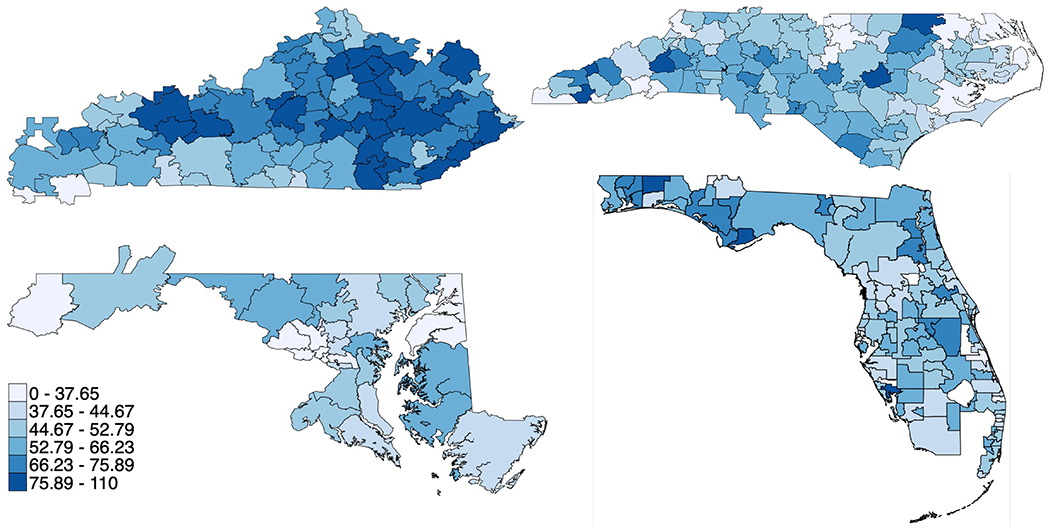
Figure 3.

Maps depicting geographic small-area variation in annual population rate of hysterectomy for benign disease per 10,000 hysterectomy-eligible residents across Hospital Service Areas in Kentucky (top left), Maryland (bottom left), North Carolina (top right), and Florida (bottom right) with darker colors for higher rates (bottom 10%ile, 10-25%ile, 25-50%ile, 50-75%ile, 75-90%ile, and top 10%ile); excludes obstetric cases and ages <18.
