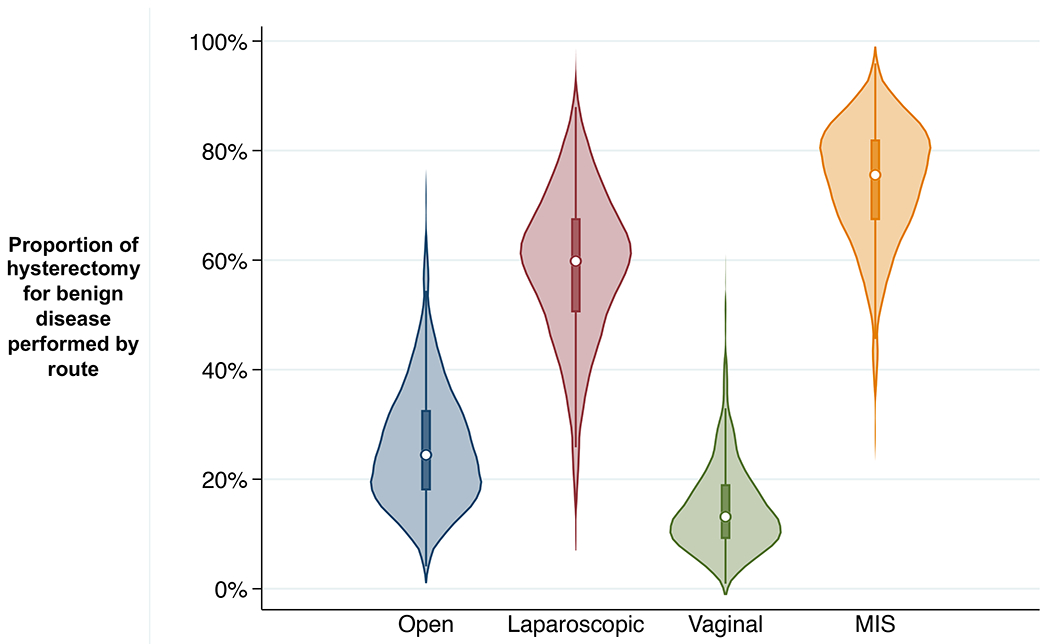
Figure 4.

Small-area variation across Hospital Service Areas in the percent of cases of hysterectomy for benign disease performed by route: open, laparoscopic, vaginal, and minimally invasive surgery (MIS; laparoscopic or vaginal), Kentucky, Maryland, Florida, and North Carolina, 2012-2016. Plotted areas represent kernel density frequency distribution of population rate estimates for individual Hospital Service Area mean rates over included years, with central dot marking median and box marking interquartile range (25th percentile to 75th percentile) for the distribution; excludes obstetric case and ages <18.
