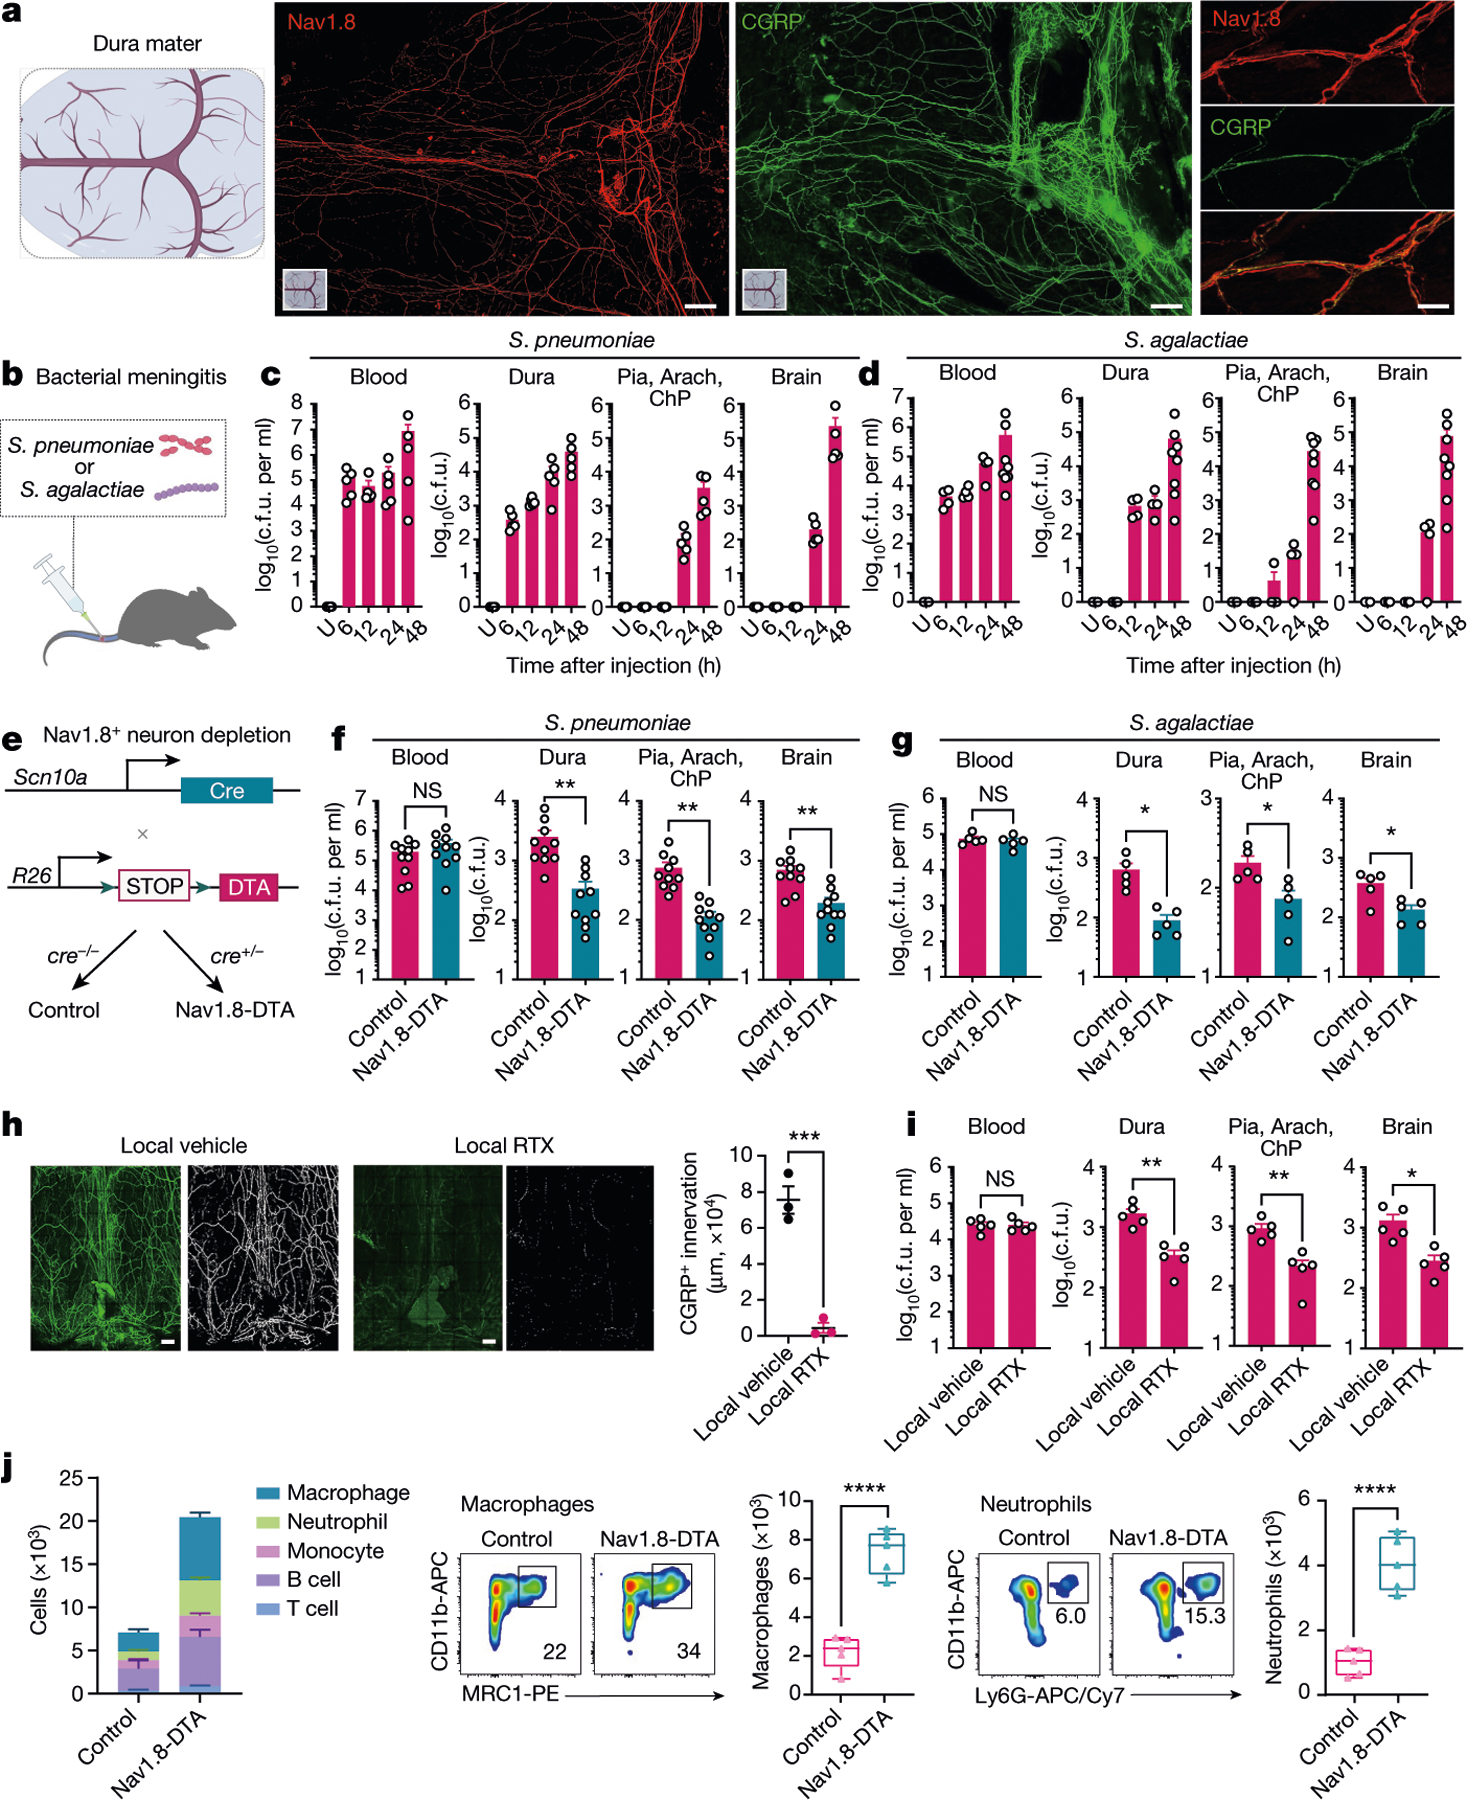
Fig. 1 |. Nociceptors regulate bacterial CNS invasion by S. pneumoniae and S. agalactiae.

a, Whole-mount confocal images of mouse brain meninges (dura mater) showing tissue innervation by Nav1.8+CGRP+ nociceptors. Scale bars, 300 μm (low magnification) and 15 μm (high magnification). b, Scheme of the haematogenous bacterial meningitis model. Mice received an intravenous injection of the bacterial pathogen S. pneumoniae (3 × 10⁷ colony forming units (c.f.u.)) or S. agalactiae (1 × 10⁸ c.f.u.). c,d, Bacterial load recovery from blood, dura mater (dura), pia mater, arachnoid mater and choroid plexus (Pia, Arach, ChP), and brain samples collected at different time points after infection determined by quantitative culture (log(c.f.u.) plotted). c, After injection with S. pneumoniae. n = 3 (uninfected (U)) or n = 5 (6 h, 12 h, 24 h, 48 h). d, After injection with S. agalactiae. n = 3 (uninfected), n = 4 (6 h, 12 h, 24 h) or n = 8 (48 h). e, Generation of Nav1.8+ nociceptor-deficient (Nav1.8-DTA) and control mice. f,g, Bacterial load in samples collected from Nav1.8-DTA and control mice 24 h after injection with S. pneumoniae (n = 10 per group) (f) or S. agalactiae (n = 5 per group) (g). h, Images and quantification of meningeal innervation by CGRP+ neurons (green) was quantified (white) after local application of RTX or vehicle above skull suture sites (n = 3 per group). Scale bar, 300 μm. i, Bacterial load in samples collected 24 h after injection with S. pneumoniae from mice treated with a localized injection of vehicle or RTX (n = 5 per group). j, Flow cytometry quantification of meningeal immune cells in the dura mater of Nav1.8-DTA and control mice 24 h after S. pneumoniae infection. Left, combined numbers of immune cell subsets analysed. Centre, representative flow cytometry plots and quantification of meningeal macrophages (Cd11b+MRC1+ gates). Right, representative flow cytometry plots and quantification of meningeal neutrophils (Cd11b+Ly6G+ gates). n = 5 per group for all analysis in j. Statistical analysis: unpaired two-sided t-tests (f–j). *P < 0.05, **P < 0.01, ***P < 0.001, ****P < 0.0001, NS, not significant. n = biologically independent samples from mouse tissues. Error bars indicate the mean ± s.e.m. Box plots show the median, interquartile range (IQR), and minimum and maximum values. Each experiment was repeated at least twice, and results presented are representative of 2 or more replicates. Exact P values are provided in Supplementary Table 1. Illustrations in a and b were created with BioRender.com.
