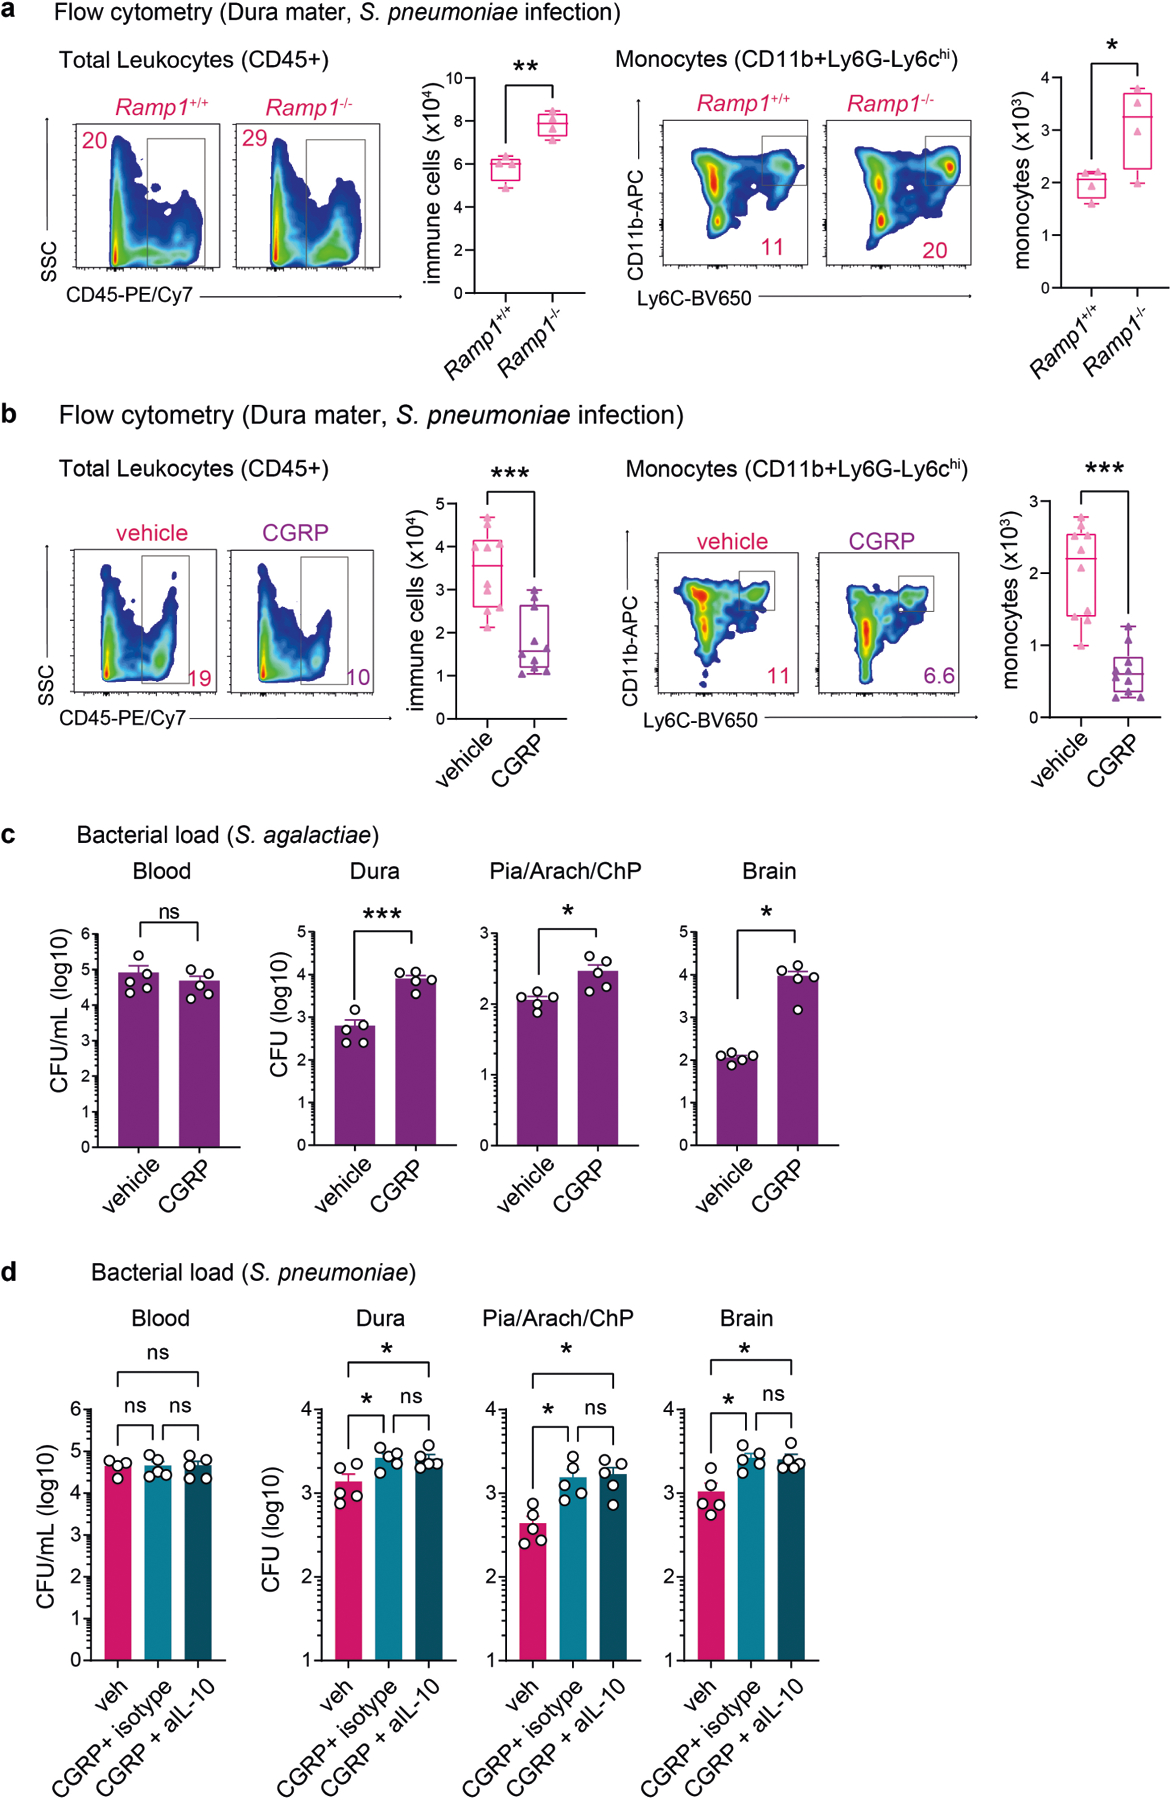
Extended Data Fig. 5 |. CGRP and RAMP1 signaling impair host response against bacterial meningitis.

a, Representative flow cytometry plots and quantification of total leukocytes (CD45+ gate) and monocytes (CD11b+ Ly6G−Ly6Chi gates) in the meninges of Ramp1 knockout (Ramp1−/−) and control (Ramp1+/+) mice 24 h after S. pneumoniae injection (n = 4/group). b, Representative flow cytometry plots and quantification of total leukocytes (CD45+ gate) and monocytes (CD11b+Ly6G−Ly6Chi gates) 24h after S. pneumoniae injection in the meninges of mice treated with CGRP or vehicle (n = 10/group). c, Bacterial load 24h after injection of S. agalactiae in samples from mice treated with CGRP or vehicle (n = 5/group). d, Bacterial load in samples collected from mice treated with vehicle (n = 4 for blood; n = 5 for meninges and brain) or CGRP (CGRP 2 μg i.p., daily) and either isotype control (n = 5) or neutralizing anti-IL-10 (200 μg i.p., daily) (n = 5). Statistical analysis: (a, b, c) Unpaired two-sided t-tests. (d) One-way ANOVA with Tukey post-tests. *p < 0.05, **p < 0.01, ***p < 0.001, ****p < 0.0001. ns = not ANOVA with Tukey post-tests. *p < 0.05, **p < 0.01, ***p < 0.001. n = biologically independent samples from mouse tissues. Each experiment was performed at least twice, and results presented are representative of 2 or more replicates. ns = not significant. Error bars = mean ±SEM. Box plots = median, IQR, min/max. Exact p-values in Supplementary Table 1.
