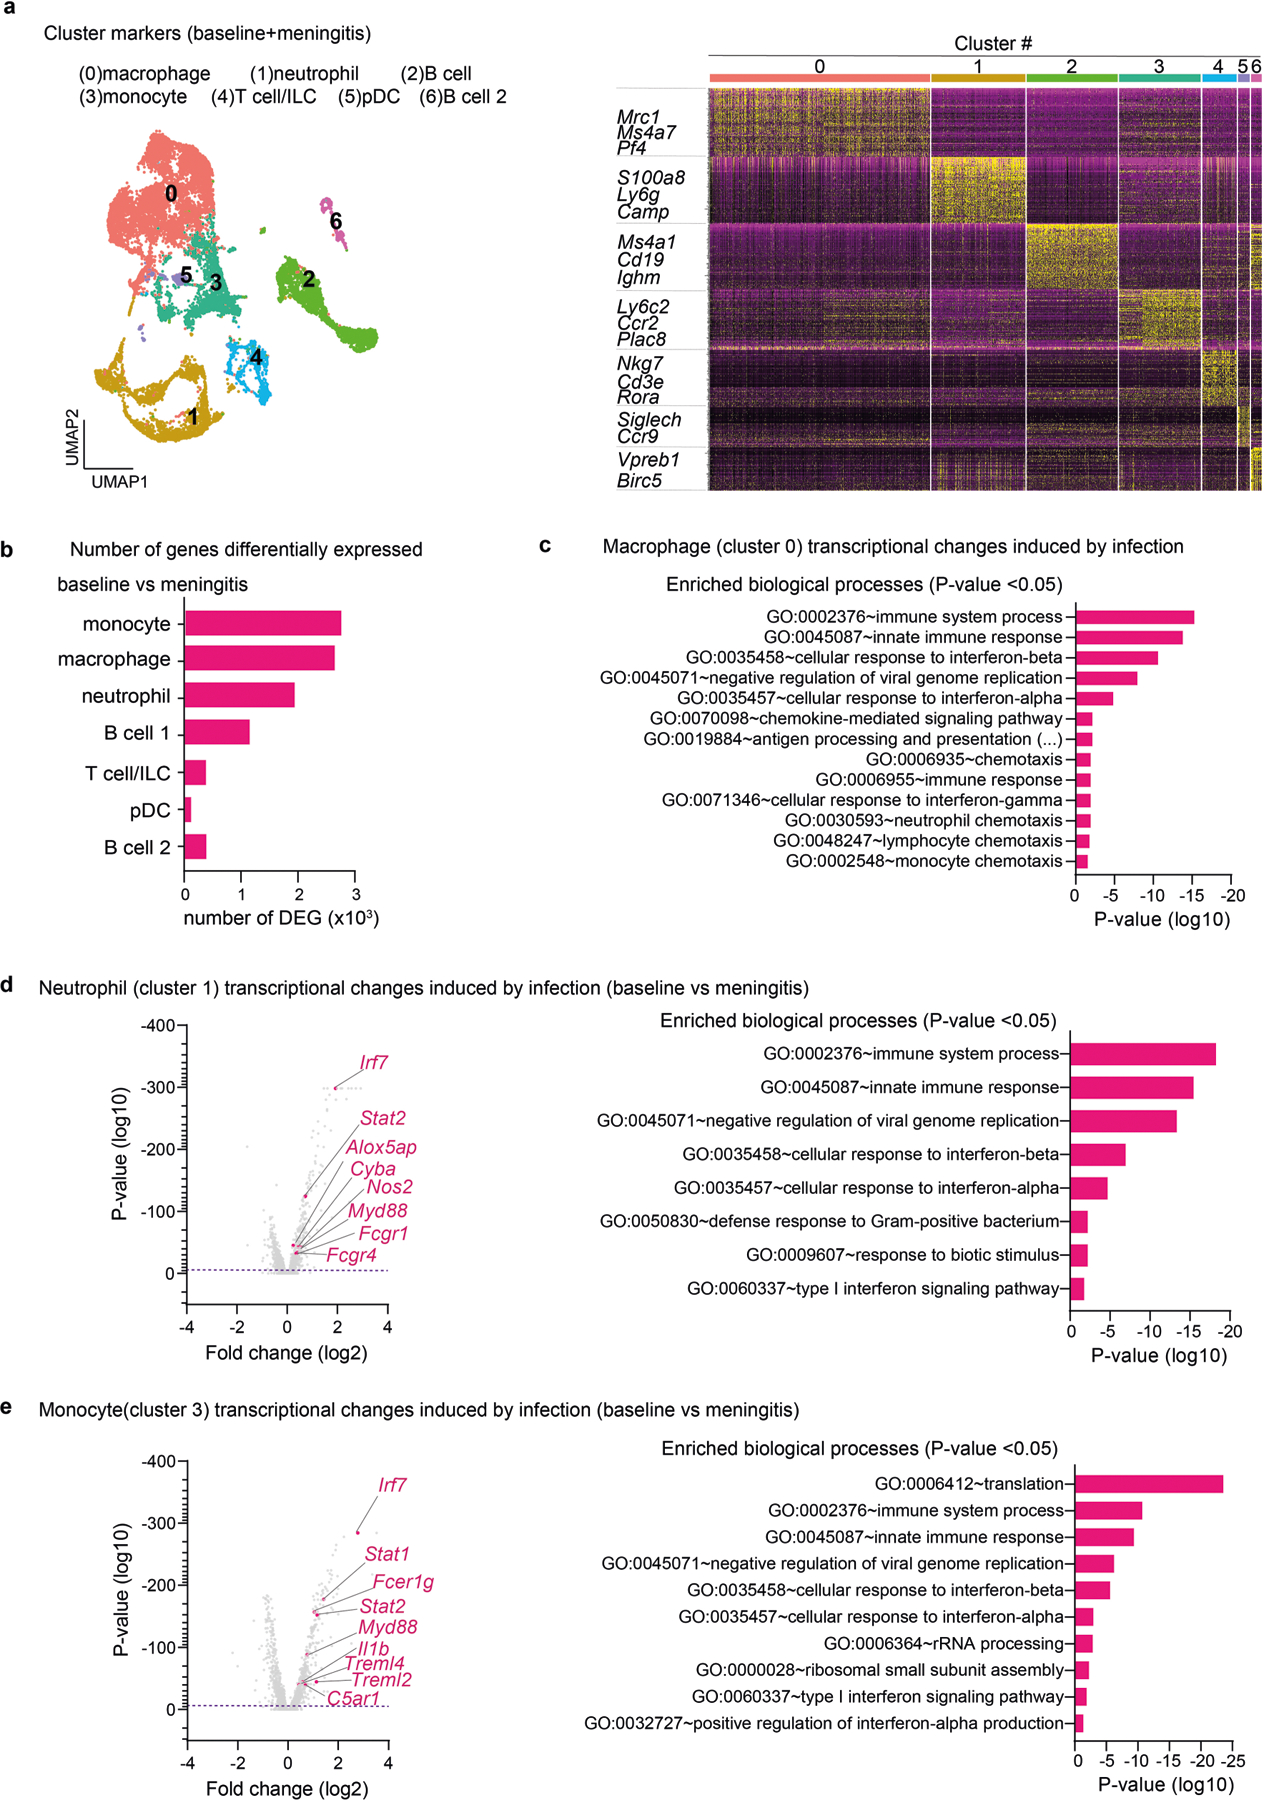
Extended Data Fig. 8 |. Transcriptional responses of meningeal immune cells to bacterial meningitis.

a, Single-cell RNA-sequencing analysis of meningeal immune responses to bacterial infection. Left, Uniform Manifold Approximation and Projection (UMAP) visualizations of CD45-positive cell types in the meninges at baseline and 24 h after injection of S. pneumoniae (meningitis). Right, heatmap showing normalized expression of 100 top cluster marker genes with key immune marker genes highlighted. b, Number of genes that were differentially expressed in each immune cell population during infection (baseline vs meningitis). c, Annotated GO biological processes of genes differentially expressed by the cluster of macrophages in response to infection (baseline vs meningitis), highlighting the enrichment of processes related to chemotaxis. d, Annotated GO biological processes and volcano plot of genes differentially expressed by the cluster of neutrophils in response to infection (baseline vs meningitis), highlighting upregulation of processes and genes related to antimicrobial activity. e, Annotated GO biological processes and volcano plot of genes differentially expressed by the cluster of monocytes in response to infection (baseline vs meningitis). (n = 10 pooled mouse meninges/group). Statistical analysis: (b, c, d, e) Fisher’s Exact score (enriched biological processes) and Wilcoxon rank-sum test (volcano plots of DEG), dashed purple line = p < 0.01.
