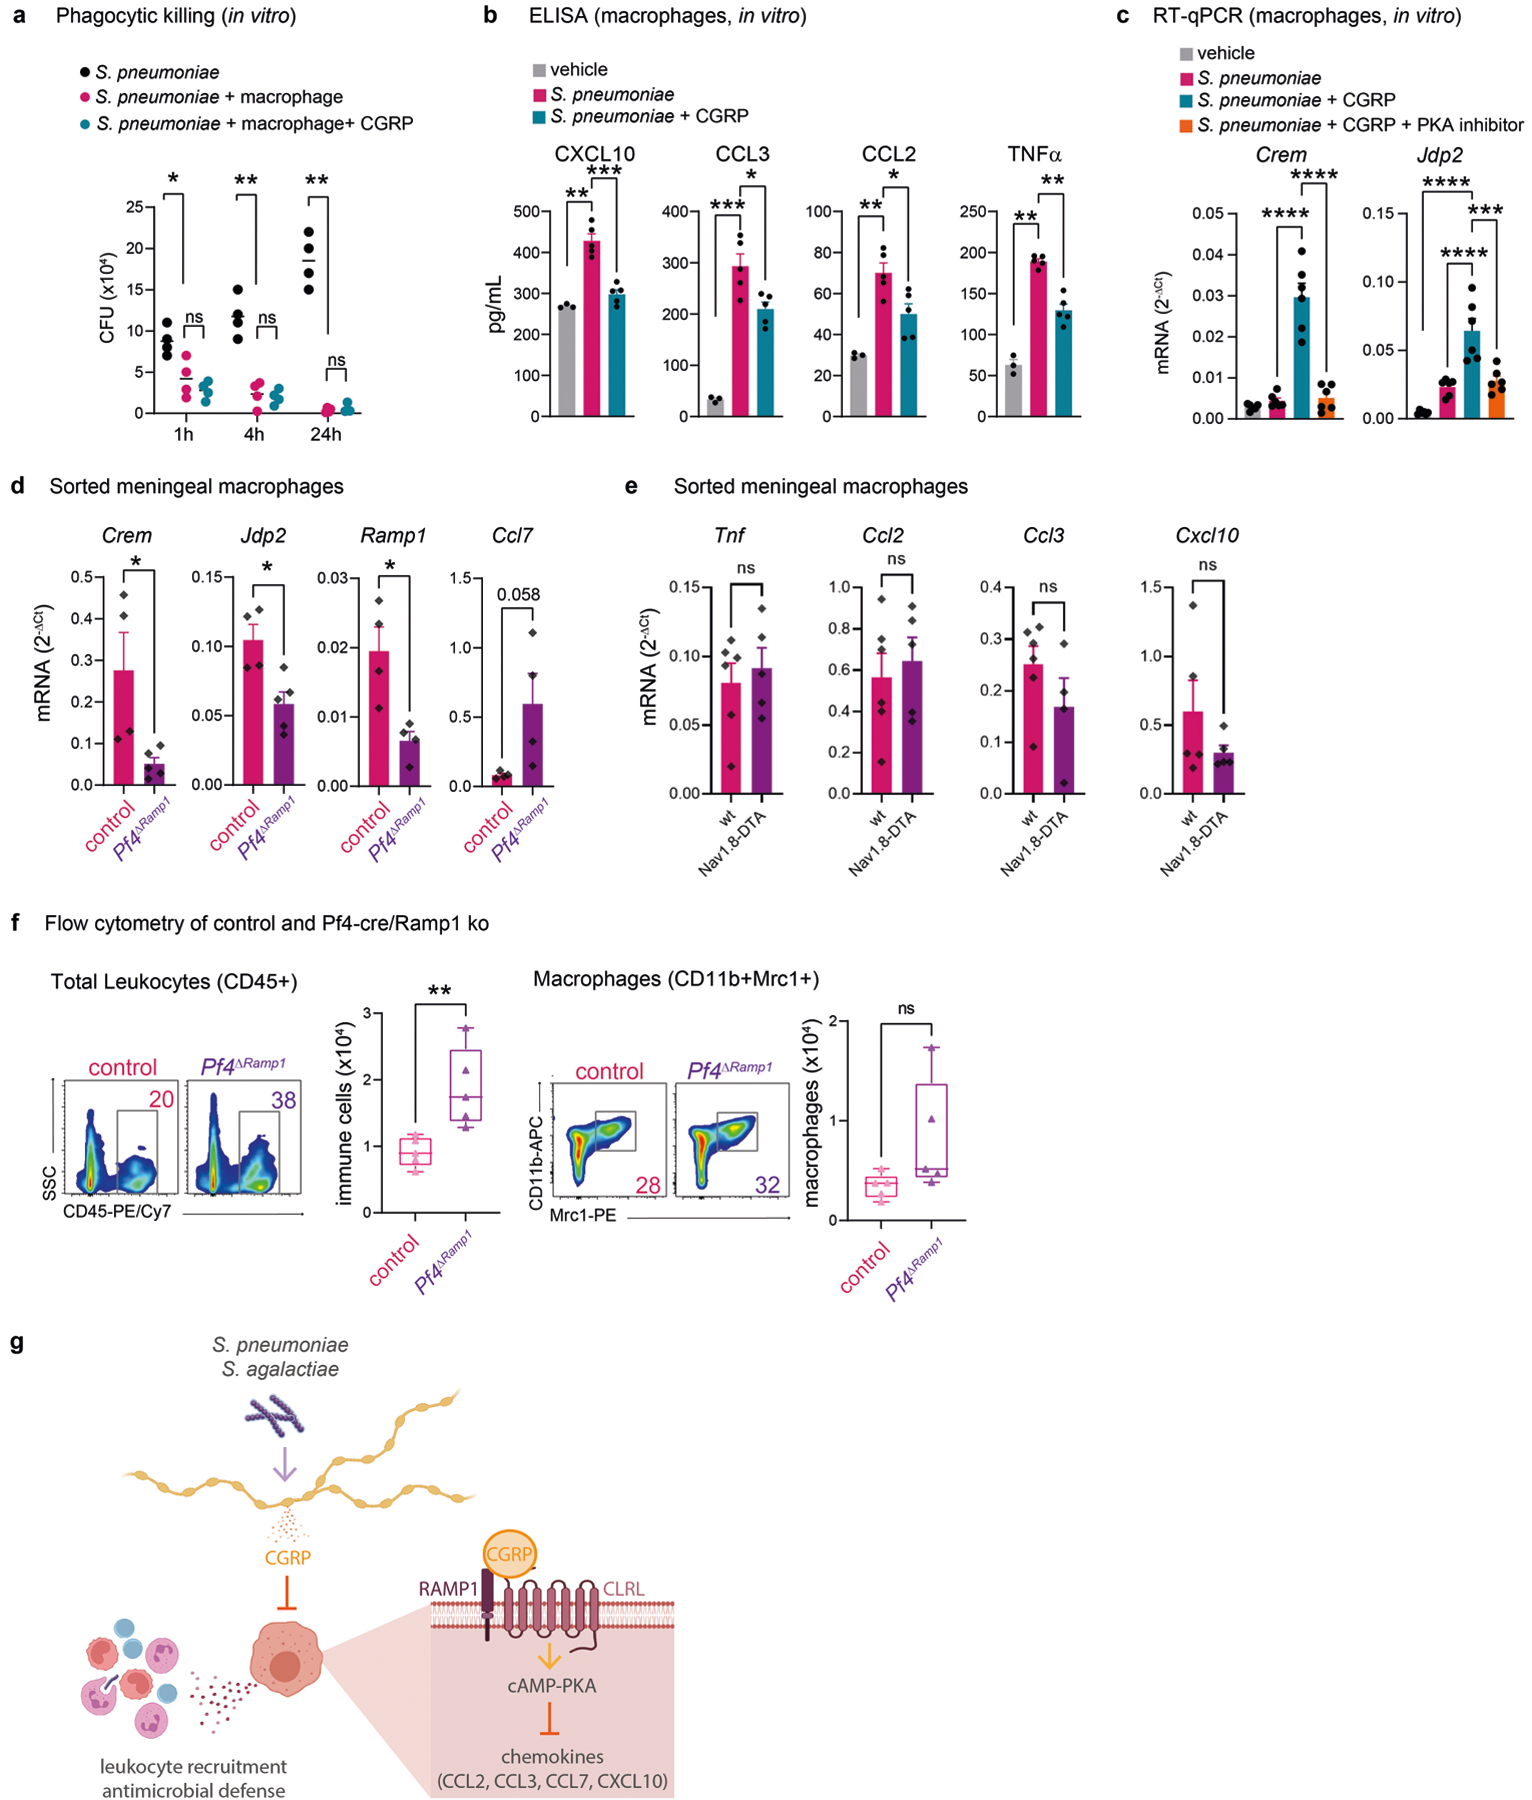
Extended Data Fig. 10 |. CGRP and RAMP1 polarization of macrophage responses.

a, Phagocytic killing assay showing amount of S. pneumoniae recovered after incubation with macrophages (BMDM) in presence of CGRP or vehicle (n = 4/group). b, Concentration of chemotaxis-related mediators in macrophage supernatants after 24 h of incubation with vehicle (n = 3), S. pneumoniae (n = 5), or S. pneumoniae+CGRP (n = 5). c, Crem and Jdp2 expression determined by qPCR in macrophages after 4 h incubation with S. pneumoniae together with CGRP, PKA inhibitor (PKAi), or vehicle. Results are normalized to Beta-actin gene expression (n = 6/group). d, Crem, Jdp2, Ramp1, and Ccl7 transcript levels determined by qPCR in FACS purified macrophages from meninges of Pf4ΔRamp1 mice (n = 5 for Crem and Jdp2; n = 4 for Ramp1 and Ccl7) or control mice (n = 4 for Crem, Jdp2, Ramp1, Ccl7) 24 h after injection of S. pneumoniae. Results are normalized to Beta-actin expression. e, Expression of chemotactic mediators determined by qPCR in meningeal macrophages from Nav1.8-DTA (n = 5) and control mice (n = 6). f, Flow cytometric quantification of total leukocytes (CD45+) and macrophages (Cd11b+Mrc1+) in meninges of Pf4ΔRamp1 and control mice 24 h after S. pneumoniae injection (n = 5/group). g, Illustration created with BioRender.com (https://biorender.com). Bacterial pathogens S. pneumoniae and S. agalactiae invade the meninges, activating trigeminal nociceptors to induce release of CGRP. CGRP acts through its receptor RAMP1 on Pf4+Mrc+ meningeal macrophages, downregulating expression of chemokines, suppressing leukocyte recruitment and antimicrobial defenses. Nociceptor ablation or blockade of CGRP signaling enhances host defense against meningitis. Statistical analysis: (a, b, c) One-way ANOVA with Tukey post-tests. (d, e, f) Unpaired two-sided t-tests. *p < 0.05, **p < 0.01, ***p < 0.001, ****p < 0.0001. n = biologically independent samples from mouse tissues (d-f) and cells (a-c). Each experiment was performed at least twice, and results presented are representative of 2 or more replicates. ns = not significant. Error bars = mean ±SEM. Box plots = median, IQR, min/max. Exact p-values in Supplementary Table 1.
