
Fig. 5 |. Meningeal macrophages are required for host defence against S. pneumoniae infection.
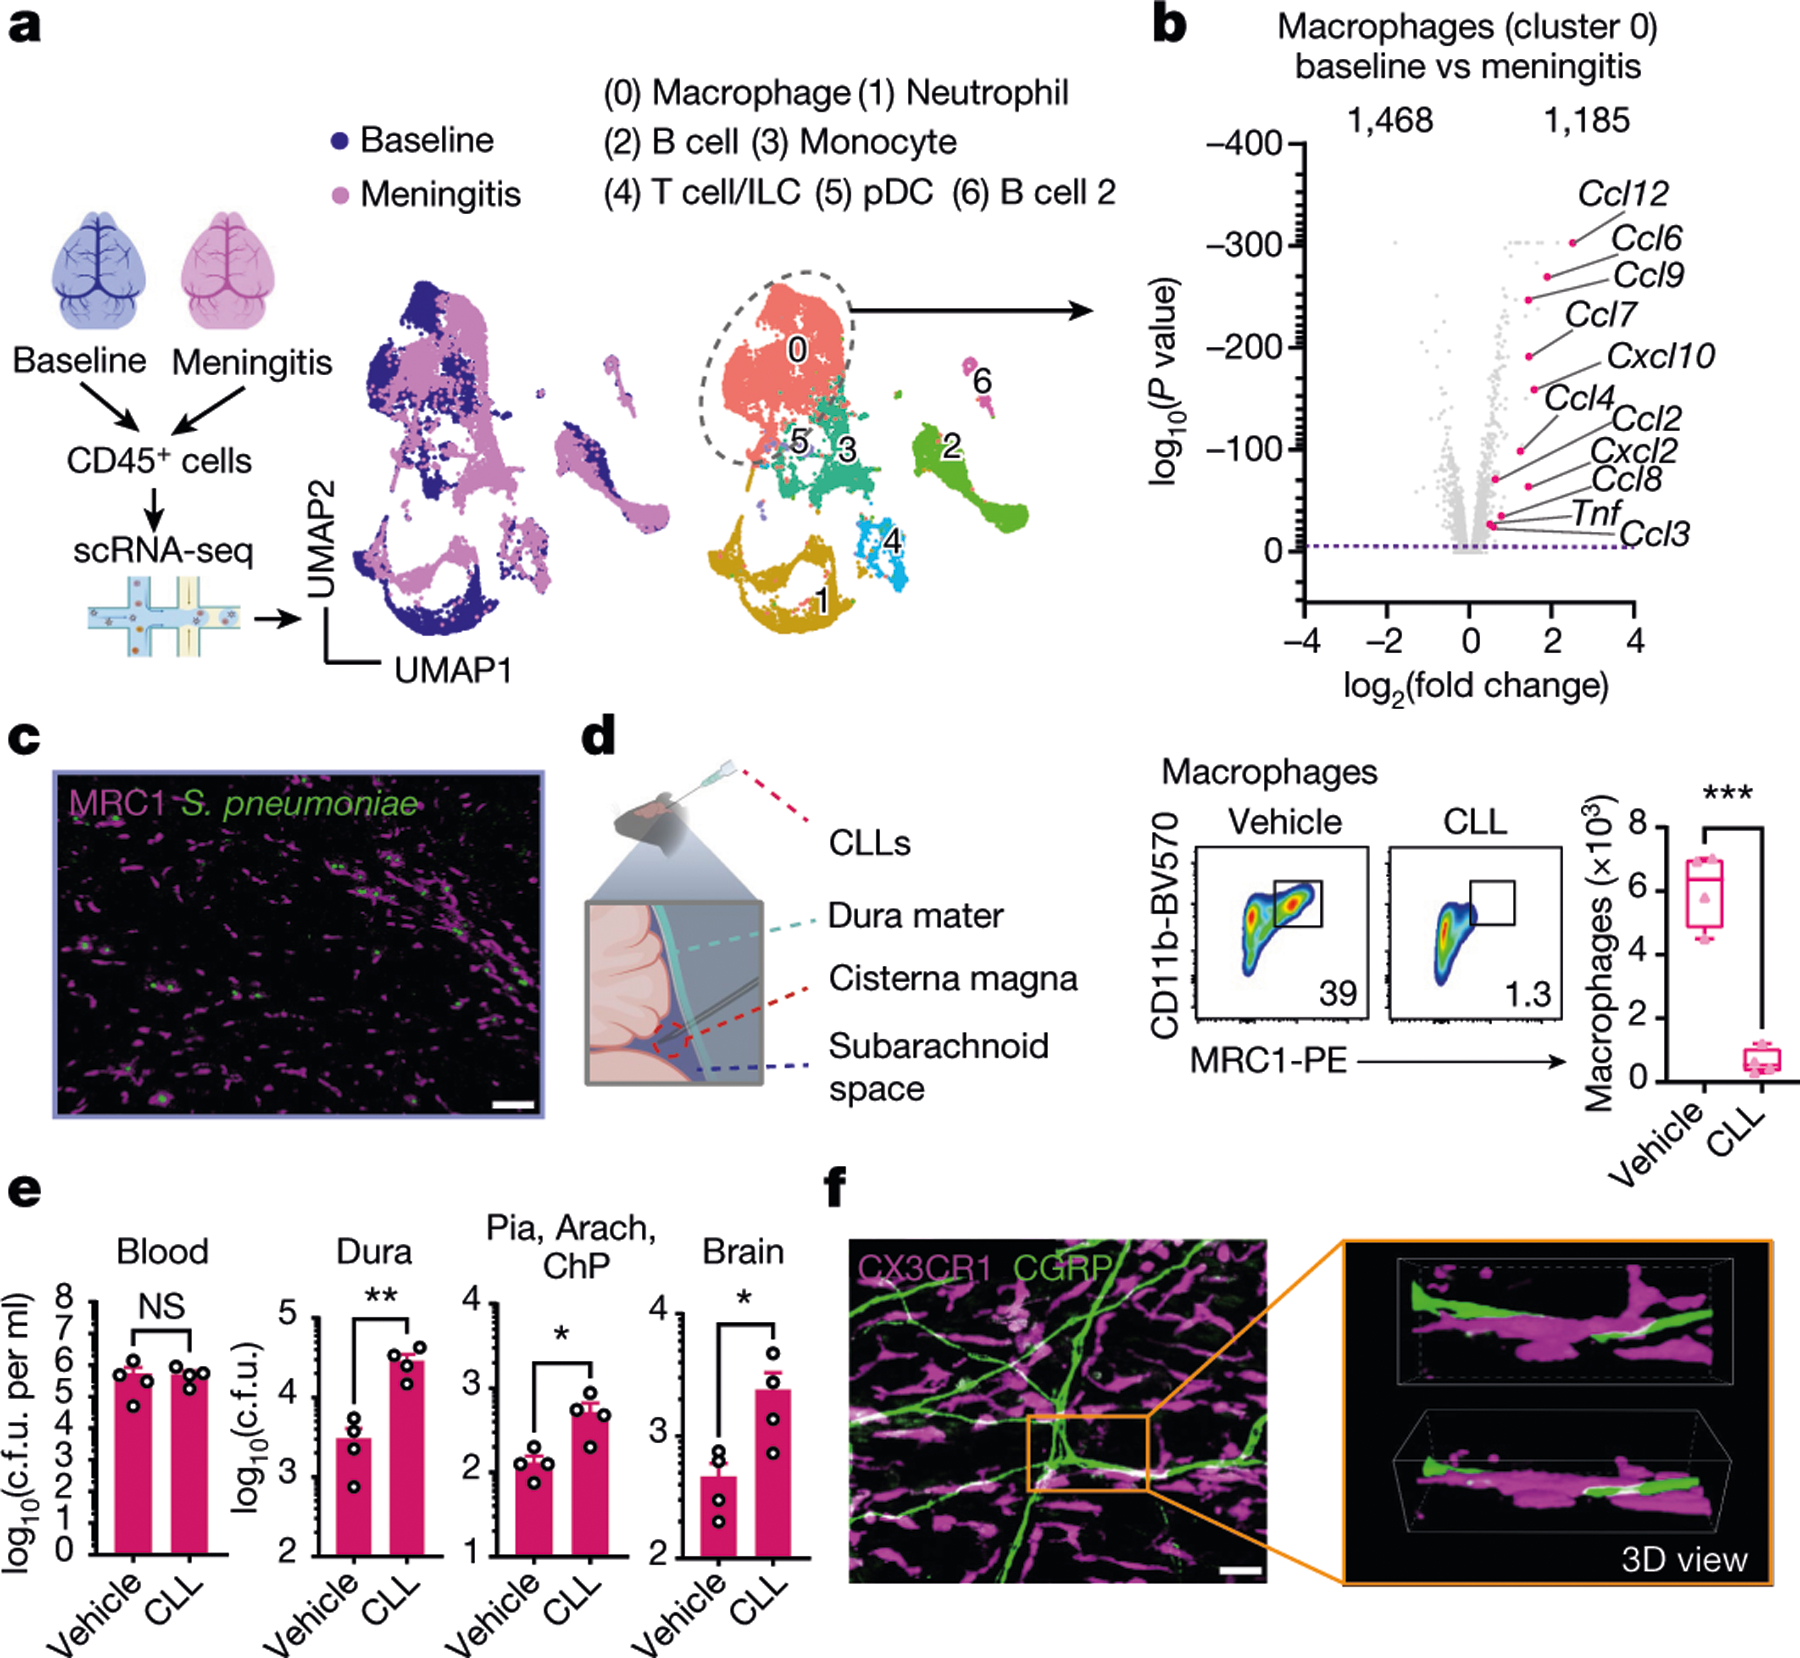
a,b, scRNA-seq analysis of meningeal immune responses to bacterial infection. a, Left, illustration of single-cell analysis of S. pneumoniae infection. Right, UMAP visualizations of CD45+ cell types in the meninges at baseline and 24 h after injection of S. pneumoniae (meningitis, 3 × 10⁷ c.f.u.). pDC, plasmacytoid dendritic cells. b, Volcano plot showing genes that are differentially expressed (1,468 downregulated genes; 1,185 upregulated genes) in the cluster of Mrc1+ macrophages in response to infection (baseline versus meningitis), highlighting the upregulation of chemotaxis-related genes (n = 10 pooled meninges per group). c, Whole-mount confocal images of mouse meninges (dura mater) showing meningeal macrophages (MRC1+ cells) associated with CMTPX-labelled S. pneumoniae 24 h after injection of bacteria. Scale bar, 25 μm. d,e, Depletion of meningeal MRC1+ macrophages by intracisternal injection of CLLs 3 days before infection. d, Left, illustration of experimental scheme. Right, flow cytometry analysis of meningeal macrophages. n = 4 per group. e, Bacterial loads 24 h after injection with S. pneumoniae (3 × 10⁷ c.f.u.) in mice treated with CLLs or vehicle. n = 4 per group. f, Whole-mount confocal images of meninges (dura mater) showing the presence of macrophages (CX3CR1+ cells) near CGRP+ nerve fibres. Scale bar, 10 μm. Statistical analysis: Wilcoxon rank-sum test, dashed line, P = 0.01 (b) or unpaired two-sided t-tests (d,e). *P < 0.05, **P < 0.01, ***P < 0.001. n = biologically independent samples from mouse tissues. Each experiment was performed at least twice, and results presented are representative of 2 or more replicates. Error bars indicate the mean ± s.e.m. Box plots show the median, IQR, and minimum and maximum values. Exact P values provided in Supplementary Table 1. Illustrations in a and d were created with BioRender.com.