
Fig. 6 |. CGRP suppresses meningeal macrophage immunity.
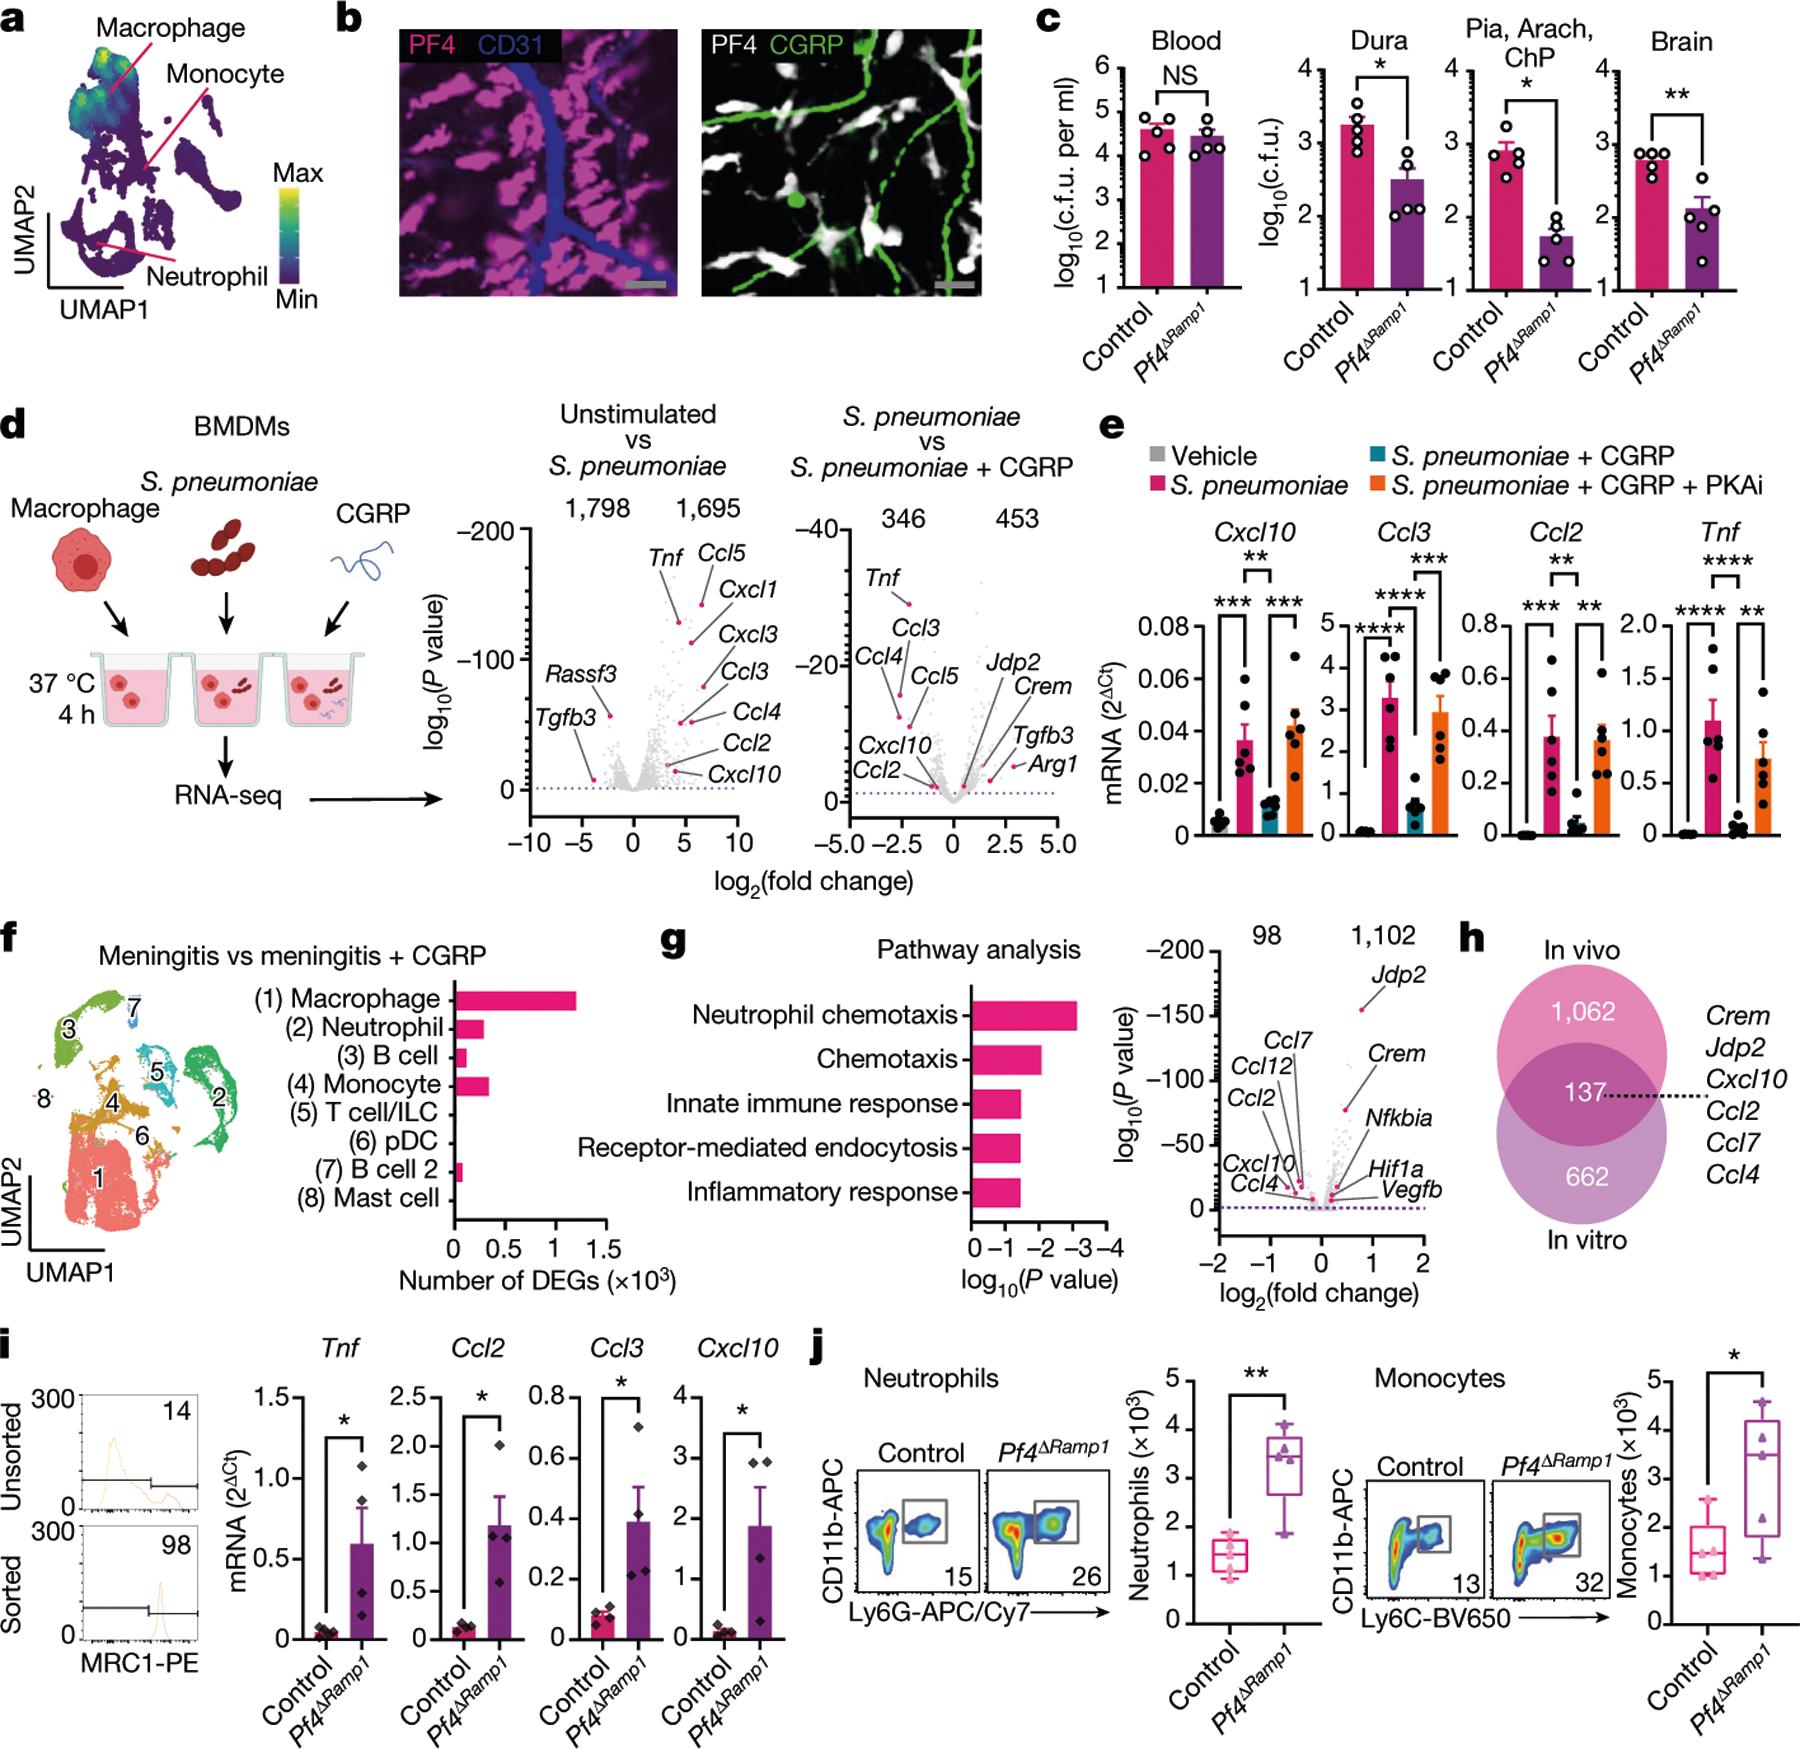
a, UMAP visualization of Pf4 expression in meningeal macrophages. b, Whole-mount meningeal images of PF4+ macrophages, CD31+ blood vessels and CGRP+ nerves. Scale bar, 15 μm. c, Bacterial load from Pf4ΔRamp1 and control mice 24 h after S. pneumoniae injection (3 × 10⁷ c.f.u.). n = 5 per group. d,e, In vitro assay using BMDMs. d, Left, illustration of experimental scheme. Right, volcano plots showing differentially expressed genes (DEGs) in unstimulated macrophages, S. pneumoniae-infected macrophages, and with CGRP treatment (S. pneumoniae versus S. pneumoniae + CGRP), highlighting chemotaxis-related genes. n = 4 per group. e, qPCR analysis of chemotaxis-related genes in macrophages exposed to S. pneumoniae, CGRP and a PKAi. n = 6 per group. f,g, scRNA-seq analysis of meningeal immune responses to infection and CGRP treatment in vivo. f, Left, UMAP visualizations of CD45+ cells in meninges from uninfected mice, infected with S. pneumoniae and/or treated with CGRP. Right, number of differentially expressed genes induced by CGRP treatment after infection in each population. g, Gene ontology (GO) biological processes of macrophages (cluster 0) (left) and volcano plot (right) of macrophage genes affected by CGRP treatment in vivo. h, Venn diagram highlighting the overlap of genes induced by CGRP in vitro and in vivo. i, qPCR of macrophages sorted from meninges of control mice (n = 5 for Tnf; n = 4 for Ccl2, Ccl3, Cxcl10) and Pf4ΔRamp1 mice (n = 4 for Tnf, Ccl2, Ccl3, Cxcl10) 24 h after S. pneumoniae injection. j, Flow cytometry of neutrophils (Cd11b+Ly6G+ gates) and monocytes (Cd11b+Ly6G−Ly6Chi gates) in meninges of Pf4ΔRamp1 and control mice 24 h after S. pneumoniae injection. n = 5 per group. Statistical analysis: Wilcoxon rank-sum test, dashed line, P = 0.01 (d,g), unpaired two-sided t-tests (c,i,j) or one-way ANOVA with Tukey post-tests (e). *P < 0.05, **P < 0.01, ***P < 0.001, ****P < 0.0001. n = biologically independent samples from mouse tissues (c,i,j) and primary cells (d,e). Each experiment was performed at least twice, and results presented are representative of 2 or more replicates. Numbers at the top of the plots in d and g indicate the number of downregulated and upregulated genes. Error bars indicate the mean ± s.e.m. Box plots show the median, IQR, and minimum and maximum values. Exact P values are provided in Supplementary Table 1. Illustration in d was created with BioRender.com.