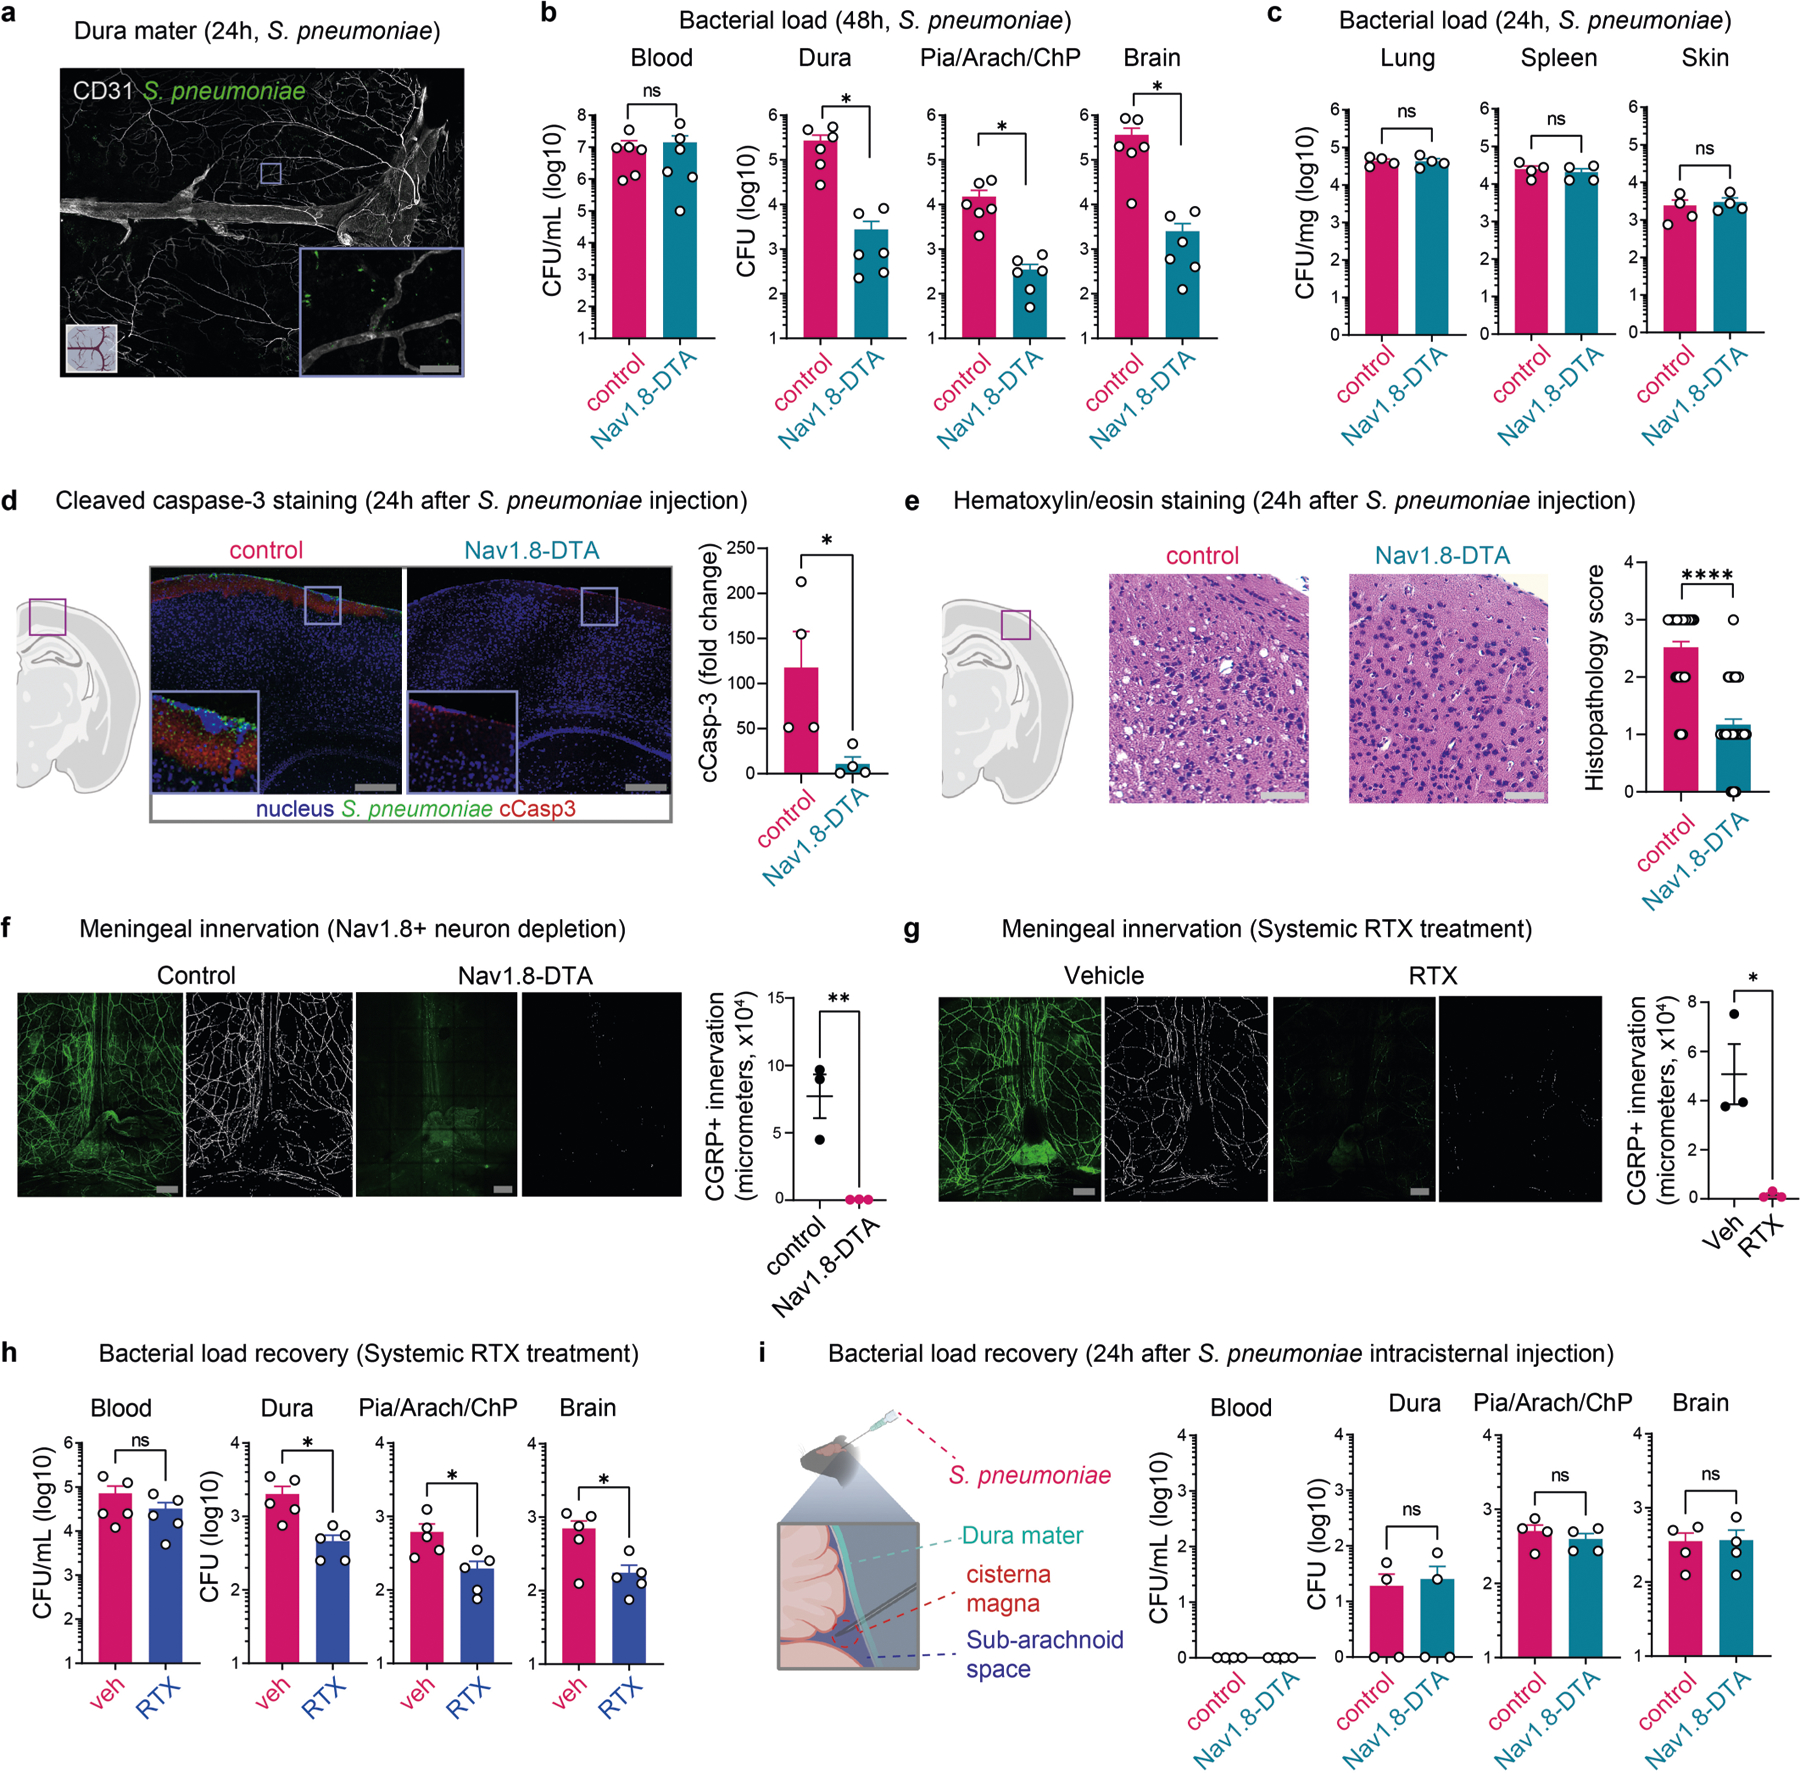
Extended Data Fig. 1 |. Nociceptors suppress meninges-mediated protection of CNS to infection.

a, Whole-mount confocal images of mouse meninges (dura mater) showing extravascular localization of S. pneumoniae 24 h post-injection of CMTPX-labeled bacteria. Scale bar = 100 μm. b, Bacterial load in samples collected from Nav1.8-DTA and control mice 48h after injection of S. pneumoniae (n = 6/group). c, Bacterial load in samples collected from Nav1.8-DTA and control mice 24 h after injection of S. pneumoniae (n = 4/group). d, Left, Illustration created with BioRender.com (https://biorender.com). Right, Imaging and quantification of cleaved caspase-3 staining in brain samples collected from Nav1.8-DTA and control mice 24 h after injection of CMTPX-labeled S. pneumoniae. Results are presented as fold-change relative to cCasp-3 staining of brain samples from uninfected mice (n = 4/group). Scale bar = 200 μm. e, Left, Illustration created with BioRender.com (https://biorender.com). Hematoxylin and eosin staining of brain sections, and blinded histopathology scores of brain samples from Nav1.8-DTA and control mice 24 h after injection of S. pneumoniae. n = 48/group (12 fields/sample, 4 samples/group). Scale bar = 50 μm. f, g, Meningeal innervation by CGRP+ neurons (green = CGRP staining; white = skeletonization) in (f) Nav1.8-DTA and control mice, and in (g) WT mice treated with systemic injection of resiniferatoxin (RTX) or vehicle (n = 3/group). Scale bar = 300 μm. h, Bacterial load in samples collected 24 h after injection of S. pneumoniae from mice treated with RTX or vehicle (n = 5/group). i, Left, illustration created with BioRender.com (https://biorender.com). Right, Bacterial load in samples collected from Nav1.8-DTA and control mice 24 h after intracisternal injection of S. pneumoniae (n = 4/group). Statistical analysis: (b—i) Unpaired t-tests. *p < 0.05, **p < 0.01, ****p < 0.0001. n = biologically independent samples from mouse tissues. Each experiment was performed at least twice, and results presented are representative of 2 or more replicates. ns = not significant. Mean ±SEM. Exact p-values in Supplementary Table 1.
