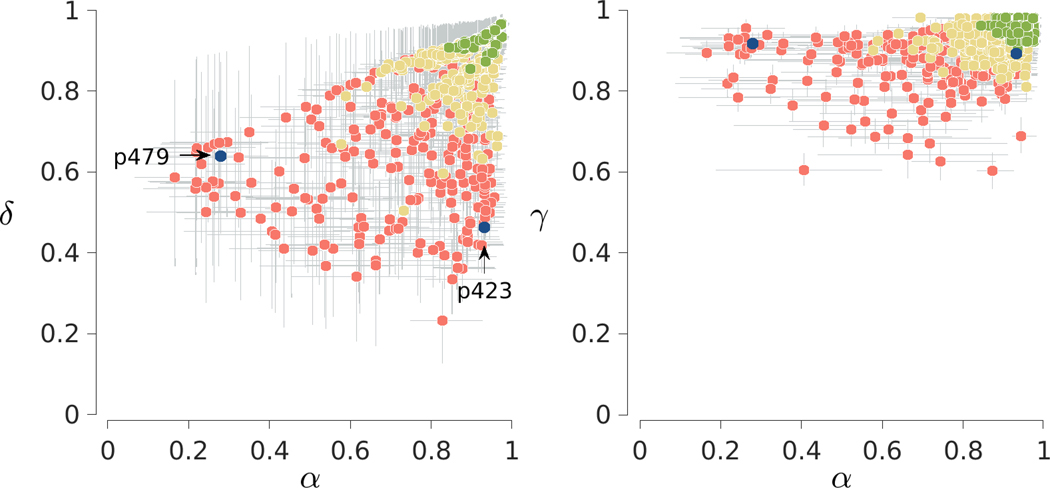
Fig. 9.
Results for the 2-back task in the Human Connectome Project. The left panel shows the joint posterior between the memory and decision parameters. The right panel shows the joint posterior between the memory and base-rate parameters. Markers show posterior means and are colored to indicate the 25% lowest accuracy (red), 50% moderate accuracy (yellow) and 25% highest accuracy (green) participants. Error bars show interquartile credible intervals. Two illustrative participants are also highlighted

