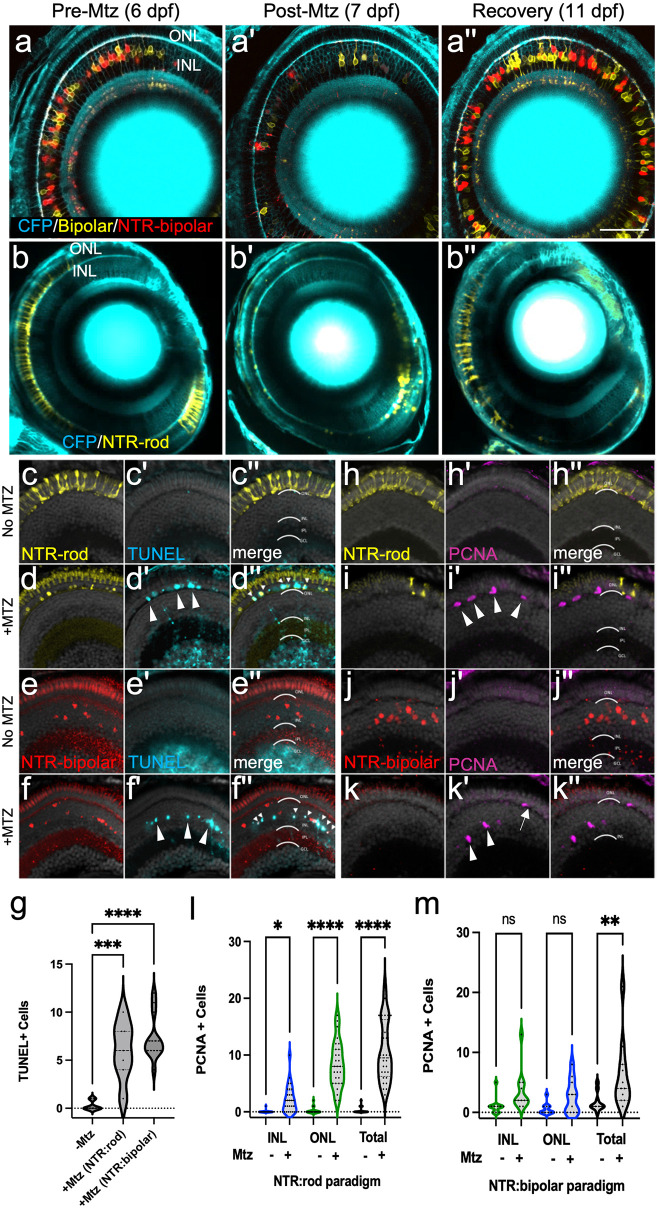
Fig 1. Two Nitroreductase (NTR) models enabling inducible retinal cell-type specific ablation.
(a-b series) In vivo time-series imaging following the NTR-bipolar (a-a”) or NTR-rod (b-b”) response to metronidazole (Mtz) treatment to induce cell death and regeneration. Images were taken in the same fish at 6 dpf (before Mtz onset, a, b), 7 dpf (after treatment, a’, b’) and 11 dpf (following recovery, a”, b”). Larvae for each ablation paradigm express CFP derived from Tg(pax6-DF4:gap43-CFP)q01 to label general retinal structures. (c-f series) Representative histological staining for TUNEL (terminal deoxynucleotidyl transferase dUTP nick end labeling) at 7 dpf in uninjured NTR-rod larvae (c-c”) and Mtz treated NTR-rod larvae (d-d”) as well as in uninjured and Mtz-treated NTR-bipolar larvae (e-e”, f-f”, respectively). (g) Quantification of TUNEL+ cell counts at 7 dpf in untreated fish (-Mtz) or following the ablation of each cell type [+Mtz (NTR-rod) and +Mtz (NTR-bipolar)]. For the statistical analysis, Welch’s one-way ANOVA was followed by student’s t test with Dunnett’s method for multiple comparisons correction. (h-k series). Representative histological staining for PCNA (proliferative cell nuclear antigen) at 9 dpf in uninjured NTR-rod larvae (h-h”) and Mtz treated NTR-rod larvae (i-i”) as well as in uninjured (j-j”) and Mtz-treated NTR-bipolar larvae (k-k”). (l,m) Quantification of PCNA+ cell counts at 9 dpf in (l) untreated NTR-rod fish or following the ablation of rods (m) and in untreated NTR-bipolar fish or following the ablation of bipolar cells. For both paradigms, quantification is split into total number of proliferative cells and those in the INL or ONL. For statistical comparisons, Student’s t test was used to assess the indicated paired conditions. Asterisks indicate the following p-value ranges: * = p<0.05, ** = p<0.01, *** = p<0.001, and **** = p<0.0001, “ns” indicates p>0.05.

