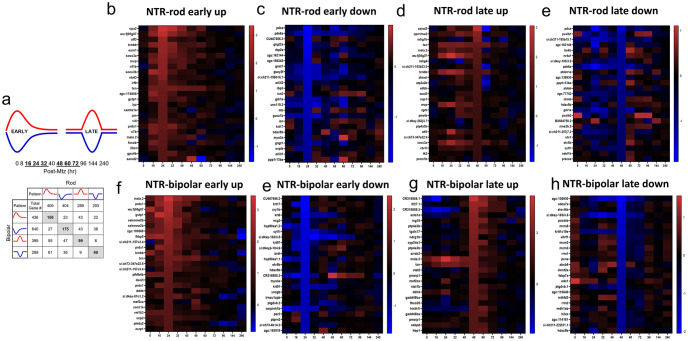
Fig 3. Identification of early and late DEG patterns and heatmaps for top DEGs in each.
(a) DEGs for each paradigm were split into upregulated (red) and downregulated (blue) as well as early (16-32h) and late (48-72h) based on peaks in Fig 2. The distribution of DEGs in these 8 patterns is shown in terms of unique and shared DEGs across both cell types. (b-h) The top 25 genes are plotted in heatmaps as a function of the largest fold changes at the middle timepoint in each pattern (24h and 60h) to demonstrate top genes defining each 8 patterns (NTR-rod and NTR-bipolar for patterns early-up, early-down, late-up and late-down).

