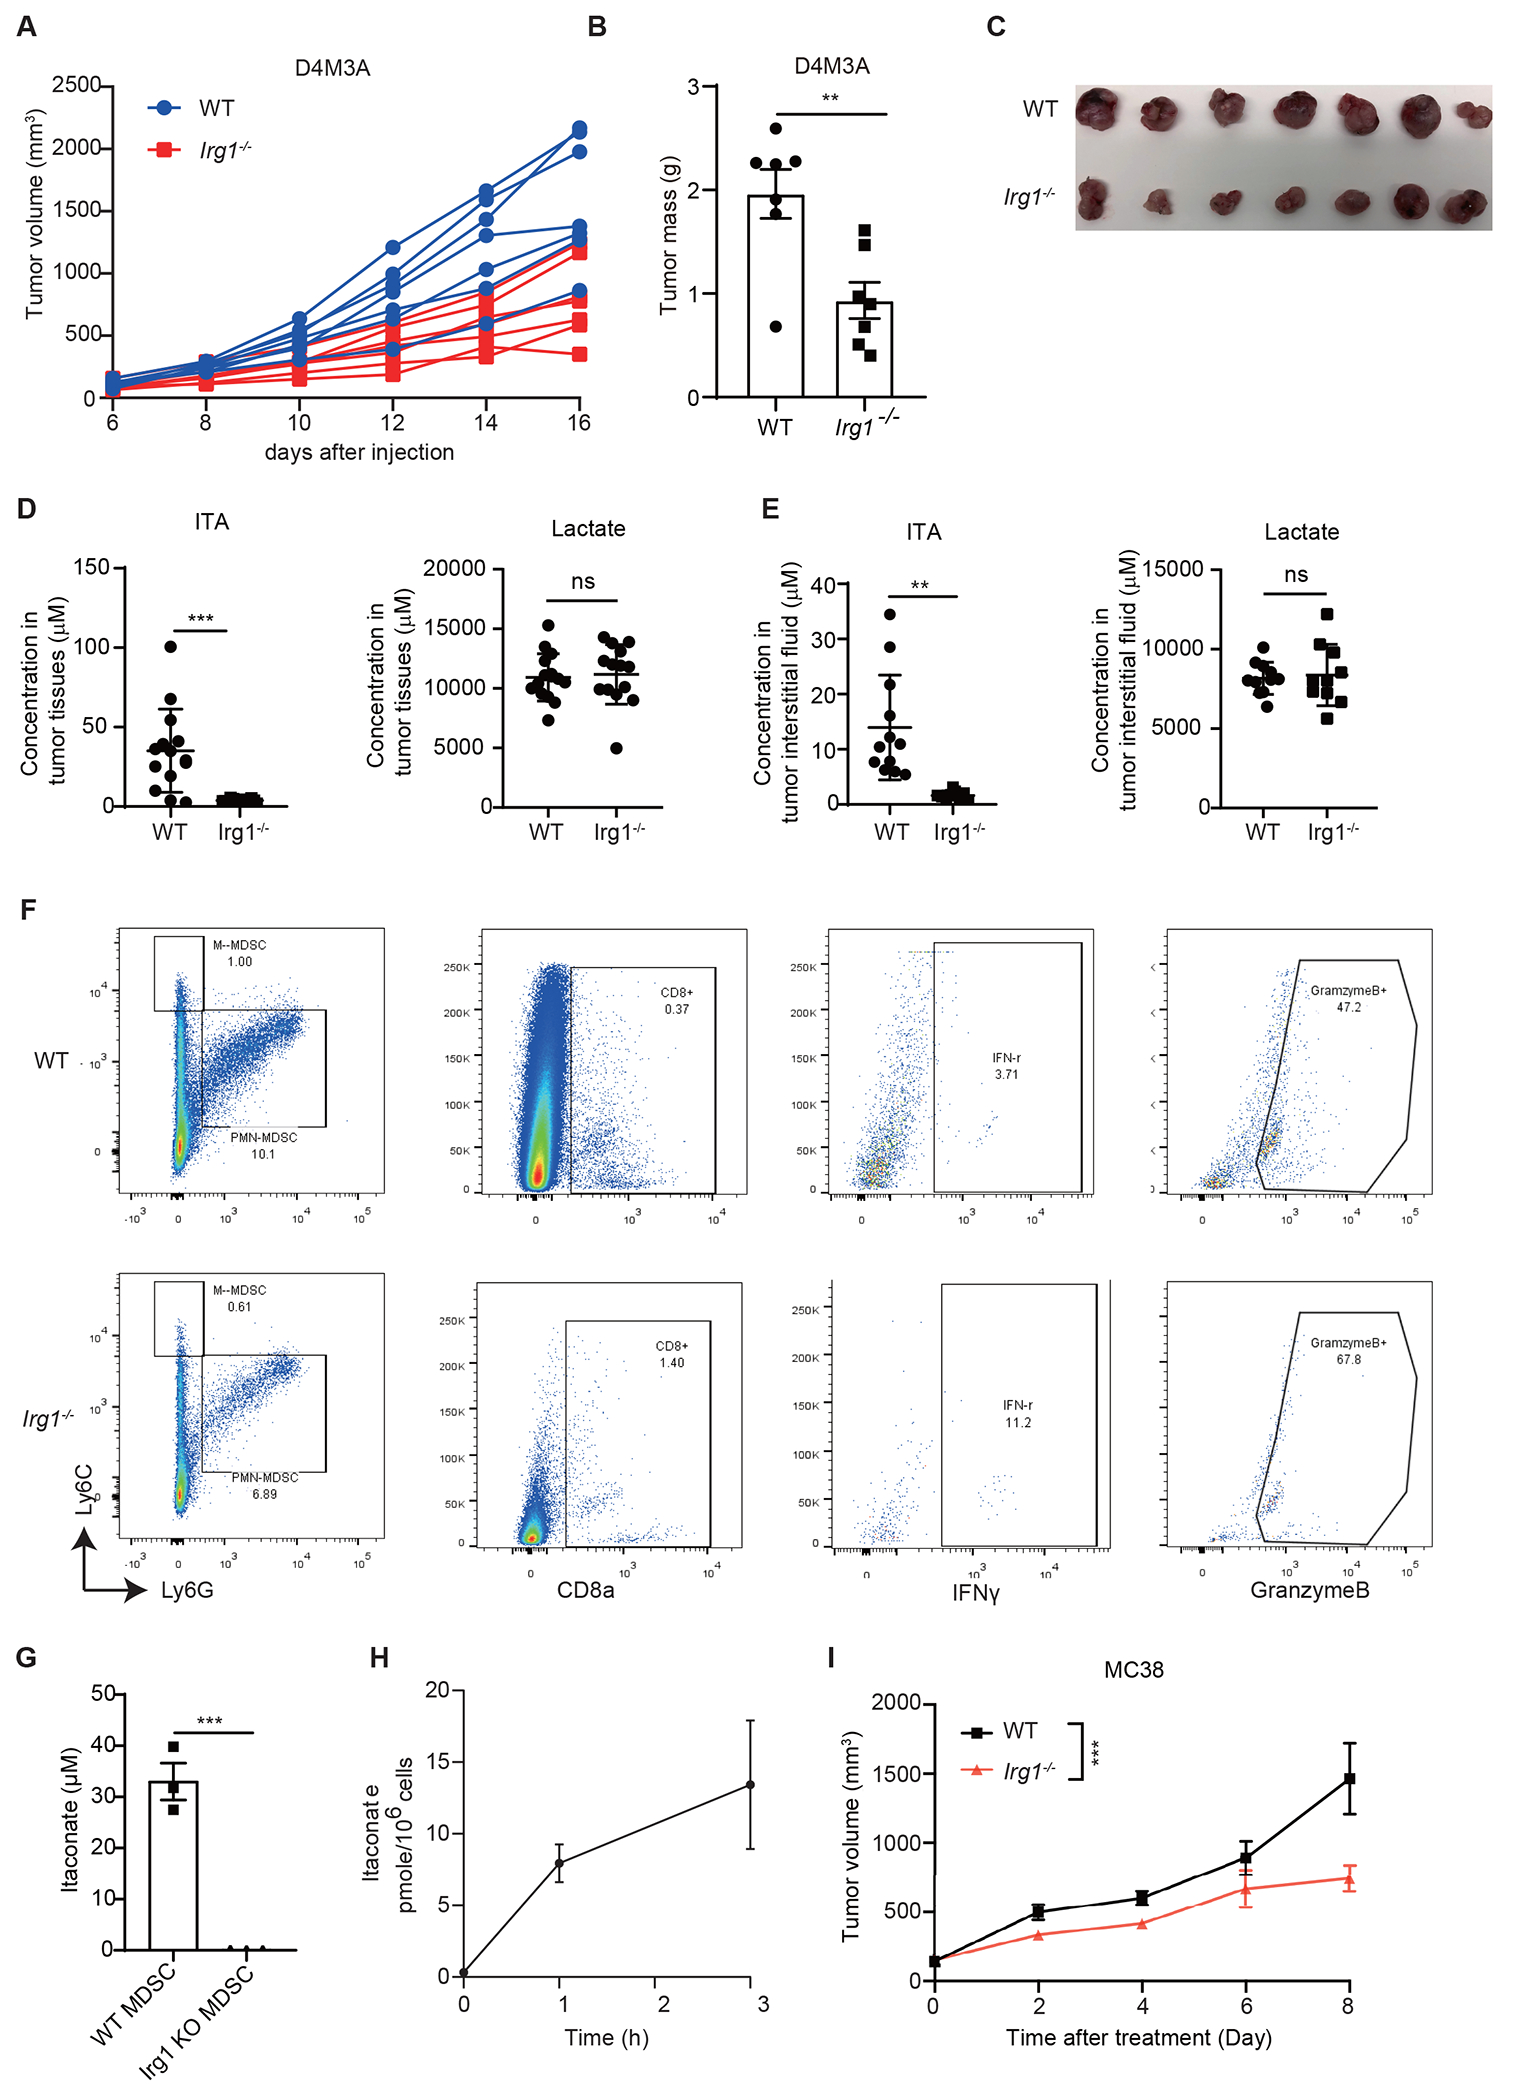
Extended Data Figure 6. Loss of Irg1 enhances anti-tumor immunity of CD8+ T cells.

(A) Spider plot of D4M3A syngeneic tumors grown in WT and Irg1−/− mice (n=7 mice).
(B) Tumor mass of D4M3A syngeneic tumors grown in WT and Irg1−/− mice (n=7 mice).
(C) Pictures of D4M3A syngeneic tumors grown in WT and Irg1−/− mice.
(D-E) Measurement of itaconate and lactate in tumor tissues (D) and interstitial fluids (E) showed measurable amounts of itaconate only in tumors grown in WT animals (n=14 for tumor tissues from both groups, n=12 for interstitial fluid samples from WT mice, n=9 interstitial fluid samples from for Irg1−/− mice).
(F) Representative flow plots of MDSCs and CD8+ T cells from D4M3A tumors grown in WT and Irg1−/− mice.
(G) Secretion of itaconate by WT BM-MDSCs versus Irg1−/− BM-MDSCs (n=3 biologically independent samples).
(H) Uptake of itaconate from the culture media of WT BM-MDSCs by CD3/CD28 activated CD8+ T cells (n=3 biologically independent samples).
(I) MC38 syngeneic tumors grown in Irg1−/− mice exhibited significantly slower grow compared to those in WT mice (n=8 mice).
p values were calculated by unpaired two-tailed t-test (B,D,E,G), two-way ANOVA (I). Data are represented as mean ± SEM.
