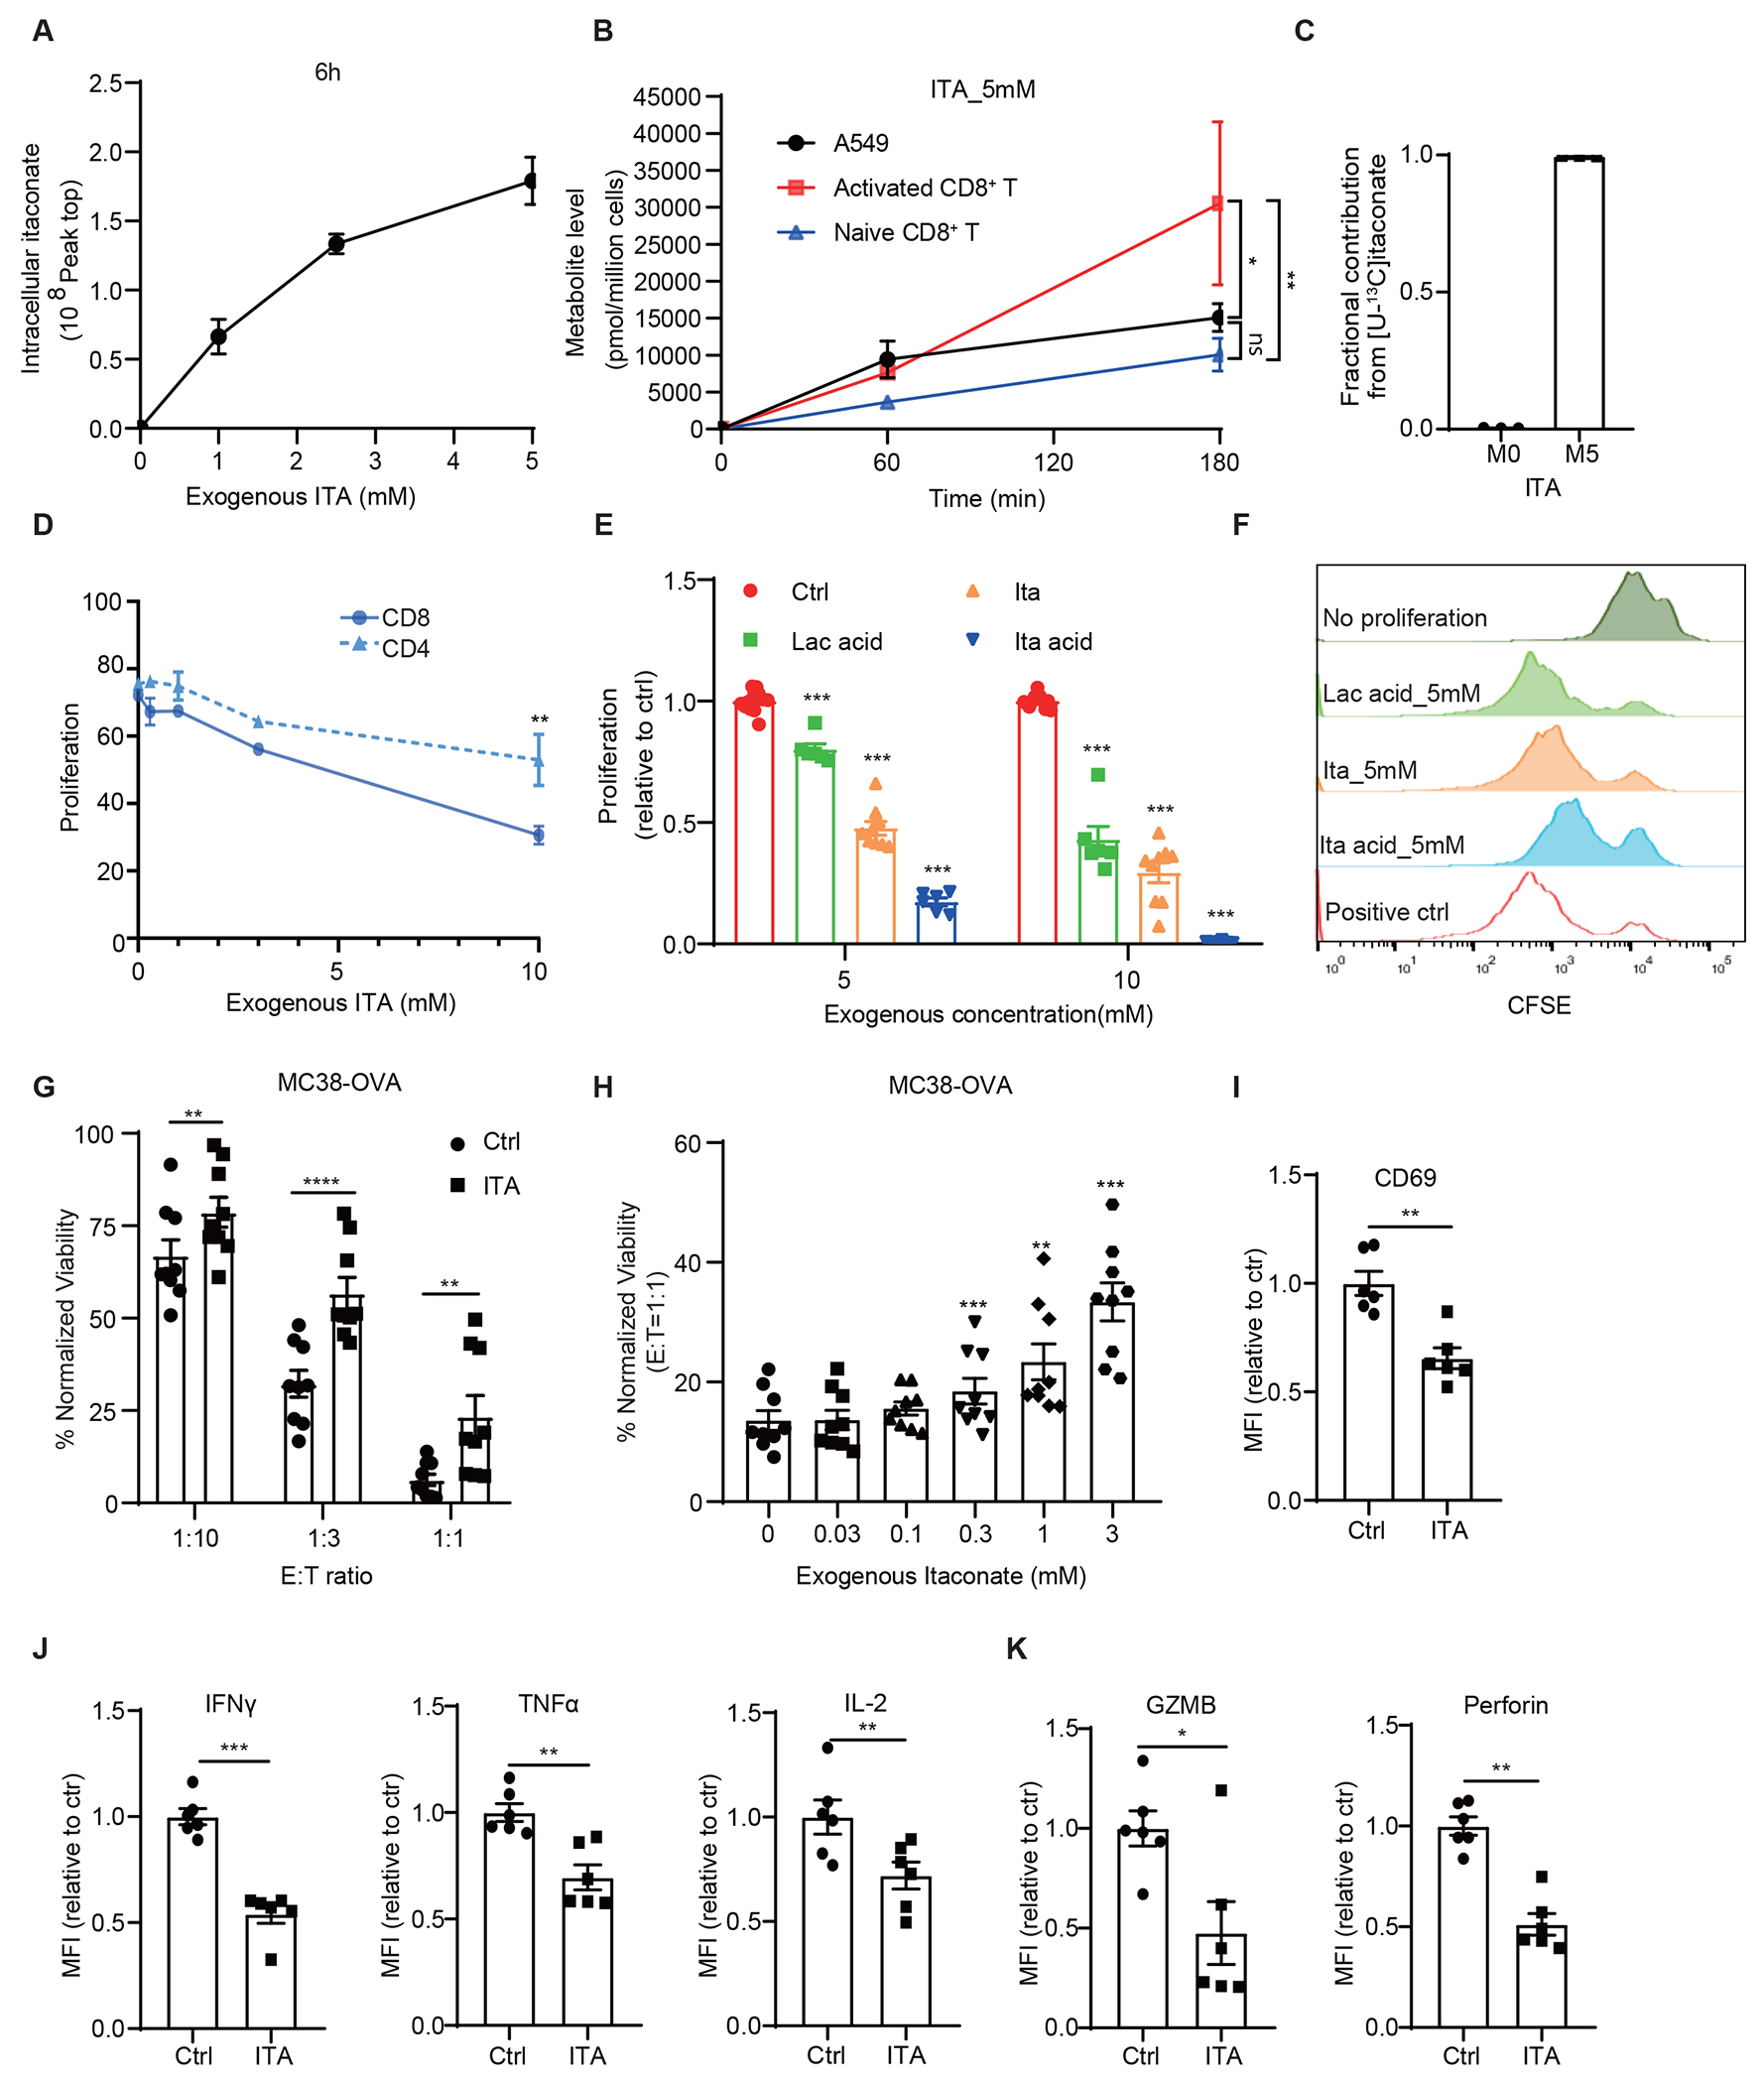
Figure 2. Itaconate suppresses CD8+ T cell proliferation and activation.

A CD3/CD28 activated CD8+ T cells took up itaconate (ITA) from media in a dose dependent manner measured at 6 h of incubation (n=3 biologically independent samples). B Activated CD8+ T cells took up itaconate at a higher rate than inactivated CD8+ and A549 cancer cell line (n=3 biologically independent samples). C Mass spectrometry analysis of activated CD8+ T cells incubated with [U-13C5]-itaconate for 6 hours revealed that the isotopically labeled species constituted nearly all the detectable itaconate in the lysates (n=3 biologically independent samples). D Effects of itaconate on the proliferation of mouse CD8+ and CD4+ T cells as measured by CFSE dilution and normalized with NaCl control (n=3 biologically independent experiments). E Effects of itaconate, itaconic acid and lactic acid on the proliferation of mouse CD8+ T cells as measured by CFSE dilution (n=12 for NaCl, n=6 for ITA acid & Lac acid, n=9 for ITA, biologically independent experiments). F Representative CFSE intensity histograms from flow cytometry analysis for (E). G Effects of itaconate on CD8+ T to killing of MC38-OVA cells. OT-1 mouse splenic CD8+ T cell were treated with 5 mM NaCl (Ctrl) or Itaconate for 5 days in the presence of OVA peptide and co-cultured with MC38-OVA cells at indicated effector cells : target cells (E:T) ratios for 24 hours, followed by measurement of cell viability of MC38-OVA cells. Data were normalized with no T cell co-culture in each group.(n=3 biologically independent experiments). H MC38-OVA cells co-cultured with itaconate-pretreated CD8+ T cell showed increased viability in an itaconate dose dependent manner. (n=3 biologically independent experiments) I-K Relative median fluorescence intensity (MFI) expression of CD69 (I), IFNγ, TNFα, IL-2, (J), Granzyme B and Perforin (K) in mouse CD8+ T cells treated with 5 mM NaCl (Ctrl) or Itaconate for 3 days in the presence of anti-CD3/CD28, as analyzed by flow cytometry (n = 6 biologically independent experiments). For (B) panels, adjusted p value was calculated using two-sided Tukey’s multiple comparisons test. For other panels, p values were calculated by paired two- tailed t-tests. Data are represented as mean ± SEM.
