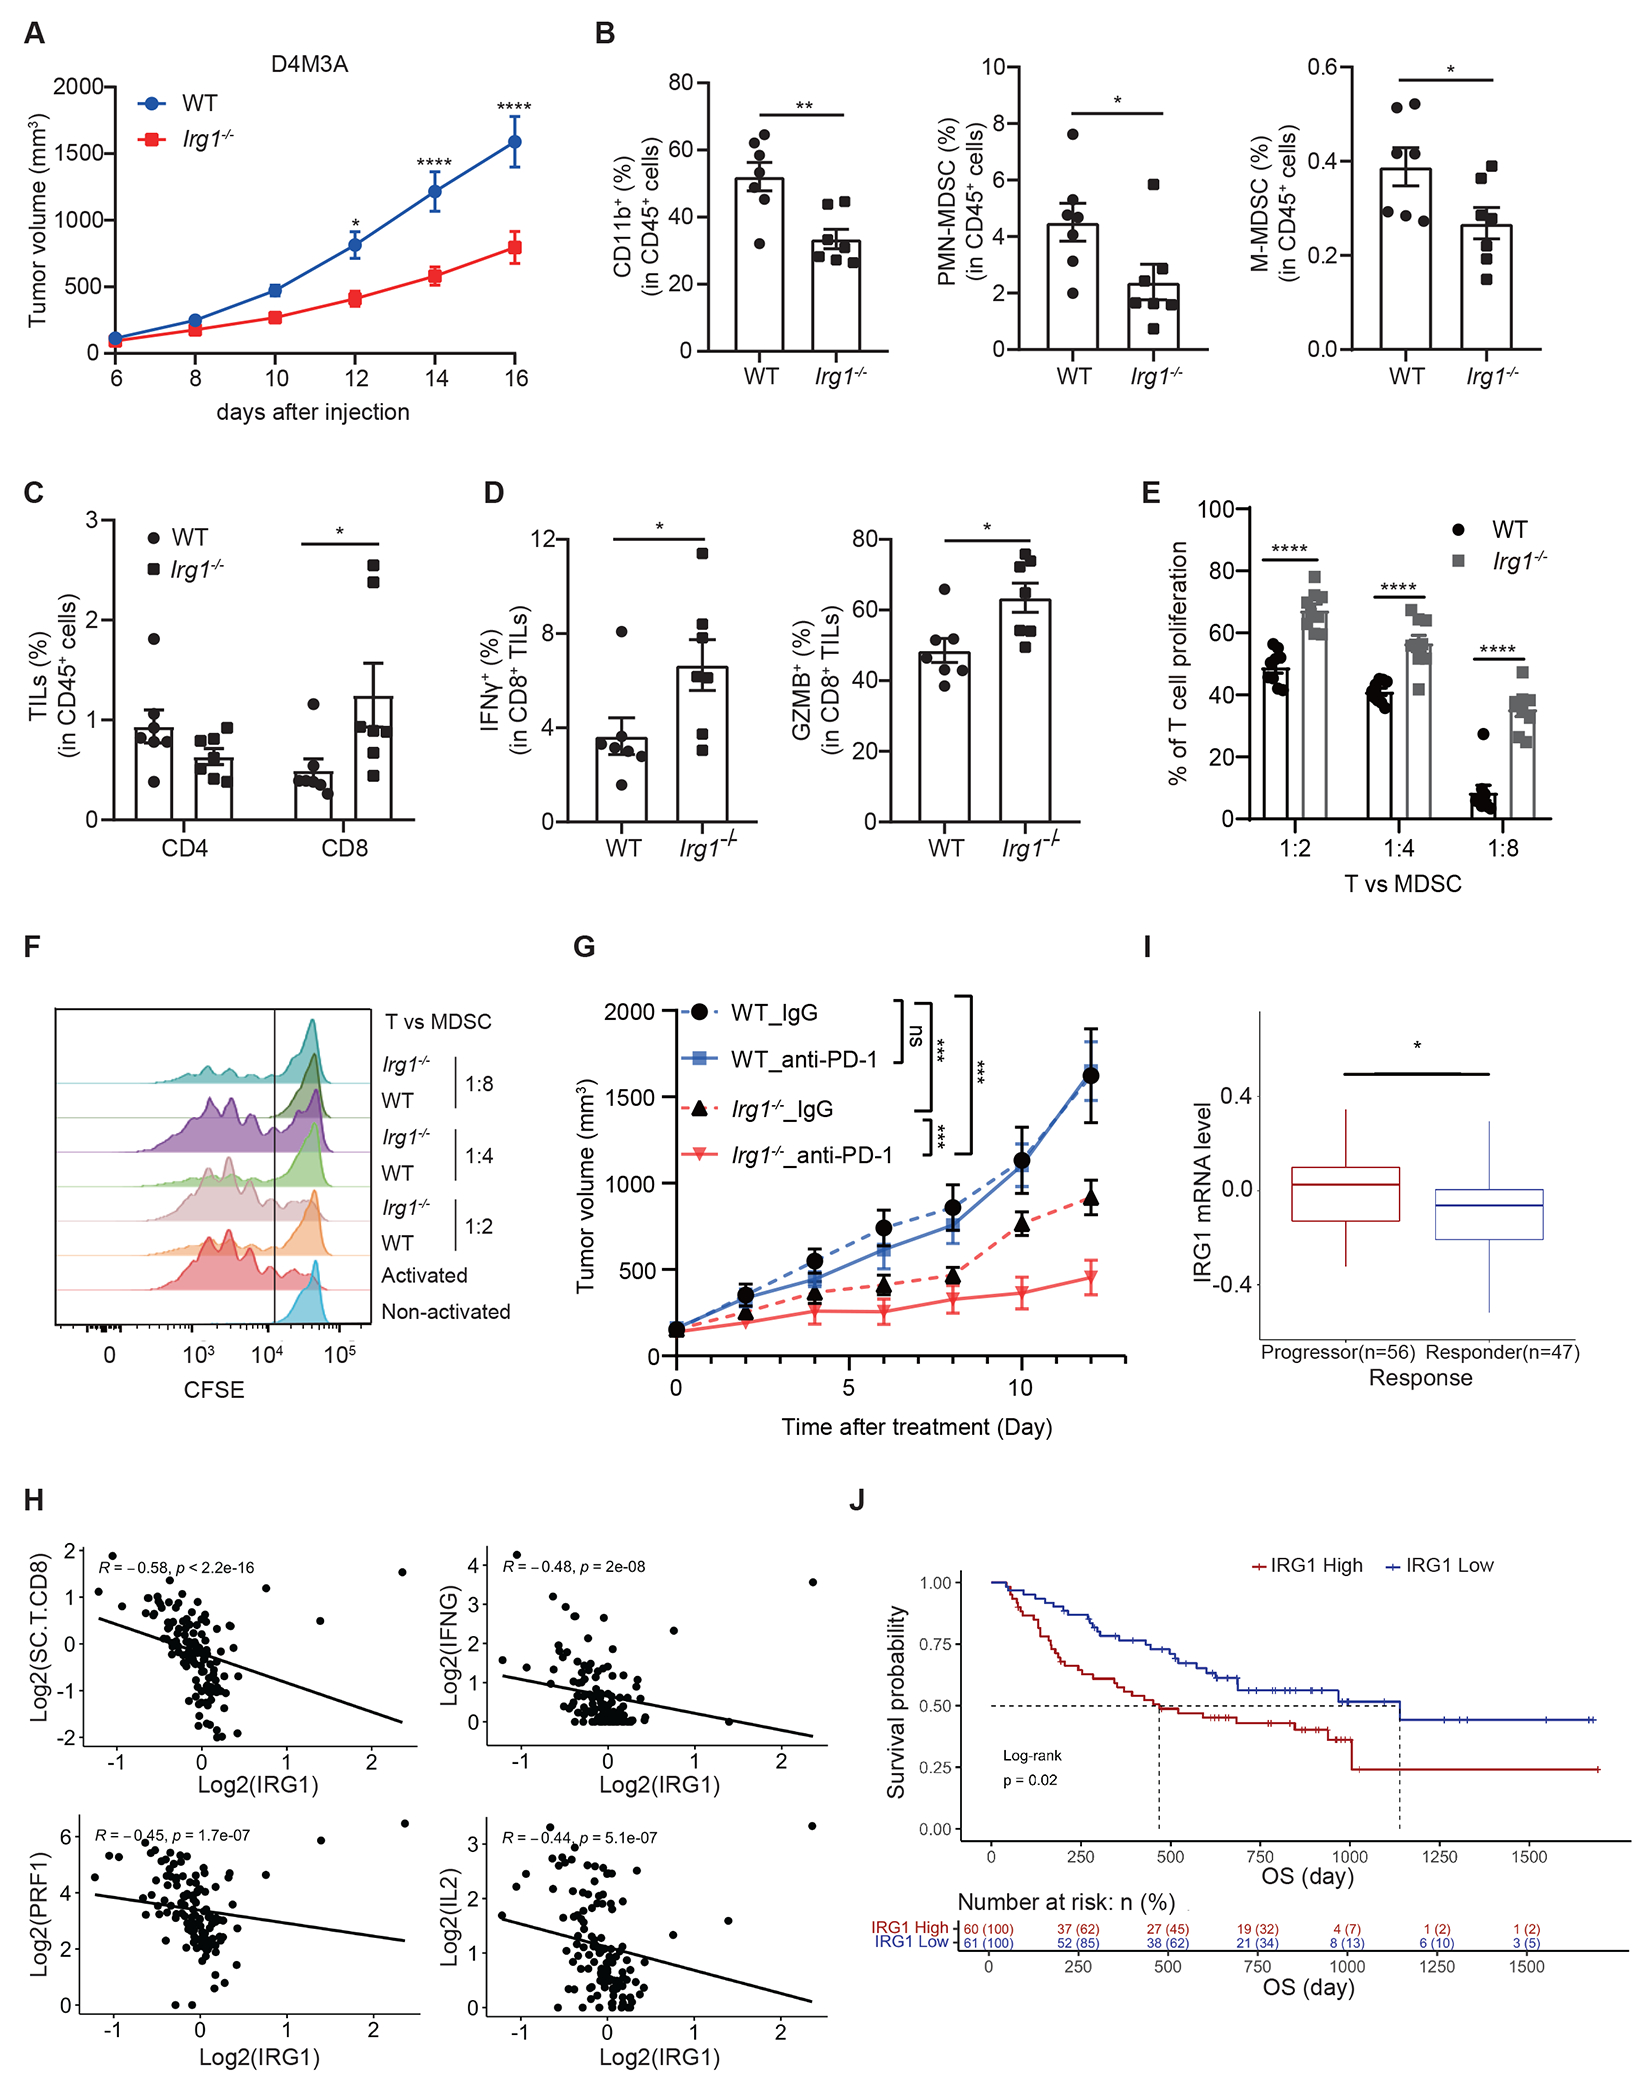
Figure 4. Loss of Irg1 enhances anti-tumor immunity of CD8+ T cells and the efficacy anti-PD-1 immune checkpoint blockade.

A Syngeneic D4M3A tumors grown in Irg1−/− mice exhibited significantly slower grow compared to those in WT mice (n=7 mice for each group). B FACS analysis revealed that tumors from Irg1−/− mice possessed lower percentages of MDSCs and macrophages (n=7 mice). C Analysis of tumor infiltrating T cells revealed similar representation of CD4+ cells but a significant increase in CD8+ cells in tumors from Irg1−/− mice (n=7 mice). D Tumor infiltrating CD8+ T cells from Irg1−/− mice showed increases in both IFNγ and Granzyme B expression (n=7 mice). E, CFSE-labeled CD8+ T cells were co-cultured at different ratios with splenic MDSCs sorted from WT or Irg1−/− D4M3A tumor-bearing mice. T cell proliferation was monitored 72 hours after co-culture by flow cytometry (n=3 biologically independent experiments). F Representative flow histograms are shown from experiments in (E). G Effects of anti-PD-1 and IgG control treatments on the growth of D4M3A tumors in WT or Irg1−/− mice (n=7 for Irg1−/− IgG group, n=6 mice for the other three groups). H An adjusted IRG1 expression score negatively correlated with Perforin (PRF1)(Spearman, R = −0.45, P = 1.7e-07), IFNG(R= −0.48, P = 2e-08), IL2(R = −0.44, P = 5.1e-07) and CD8+ T cells immune scores(R = −0.58, P < 2.2e-16). Spearman correlation was performed in all cases above. I Adjusted IRG1 expression level in progressors (n = 56 patients) is higher than in responders (n = 47 patients) (two-sided Mann-Whitney test, P=0.023). Data are presented with median values shown in boxplots, where the lower and upper hinges correspond to 25th and 75th percentiles of the data. The lower and upper whisker range from the first quartile – 1.5*IQR to the third quartile + 1.5*IQR. For visualization purposes, outliers (defined as smaller than first quartiles - 1.5*IQR or larger than third quartile + 1.5*IQR) were not shown in the plot, but all data were included in statistical testing. Mann-Whitney test was performed to compare IRG1 expression level between progressors and responders, without multiple comparisons adjustments. The 95% confidence interval is [0.01, 0.14], effect size is 0.224, and p value is 0.0233. J Kaplan Myer analysis of metastatic melanoma patients treated with anti-PD-1 therapy stratified by low vs high expression score of IRG1 revealed significant differences in survival with median OS of 1139 and 468 days, respectively. Overall survival (OS) outcomes stratified by high versus low IRG1 mRNA expression score (split by the median) in a cohort of metastatic melanoma patients treated with anti-PD-1 therapy (n= 121). Tumors with high IRG1 score associated with worse OS (two-sided Kaplan Meier log-rank test, P = 0.02). Adjusted p values were calculated using two-sided Sidak’s multiple comparisons test (A, G), or unpaired two-tailed student’s test (B-E). *p<0.05.. Data are represented as mean ± SEM (A, B-E, G).
