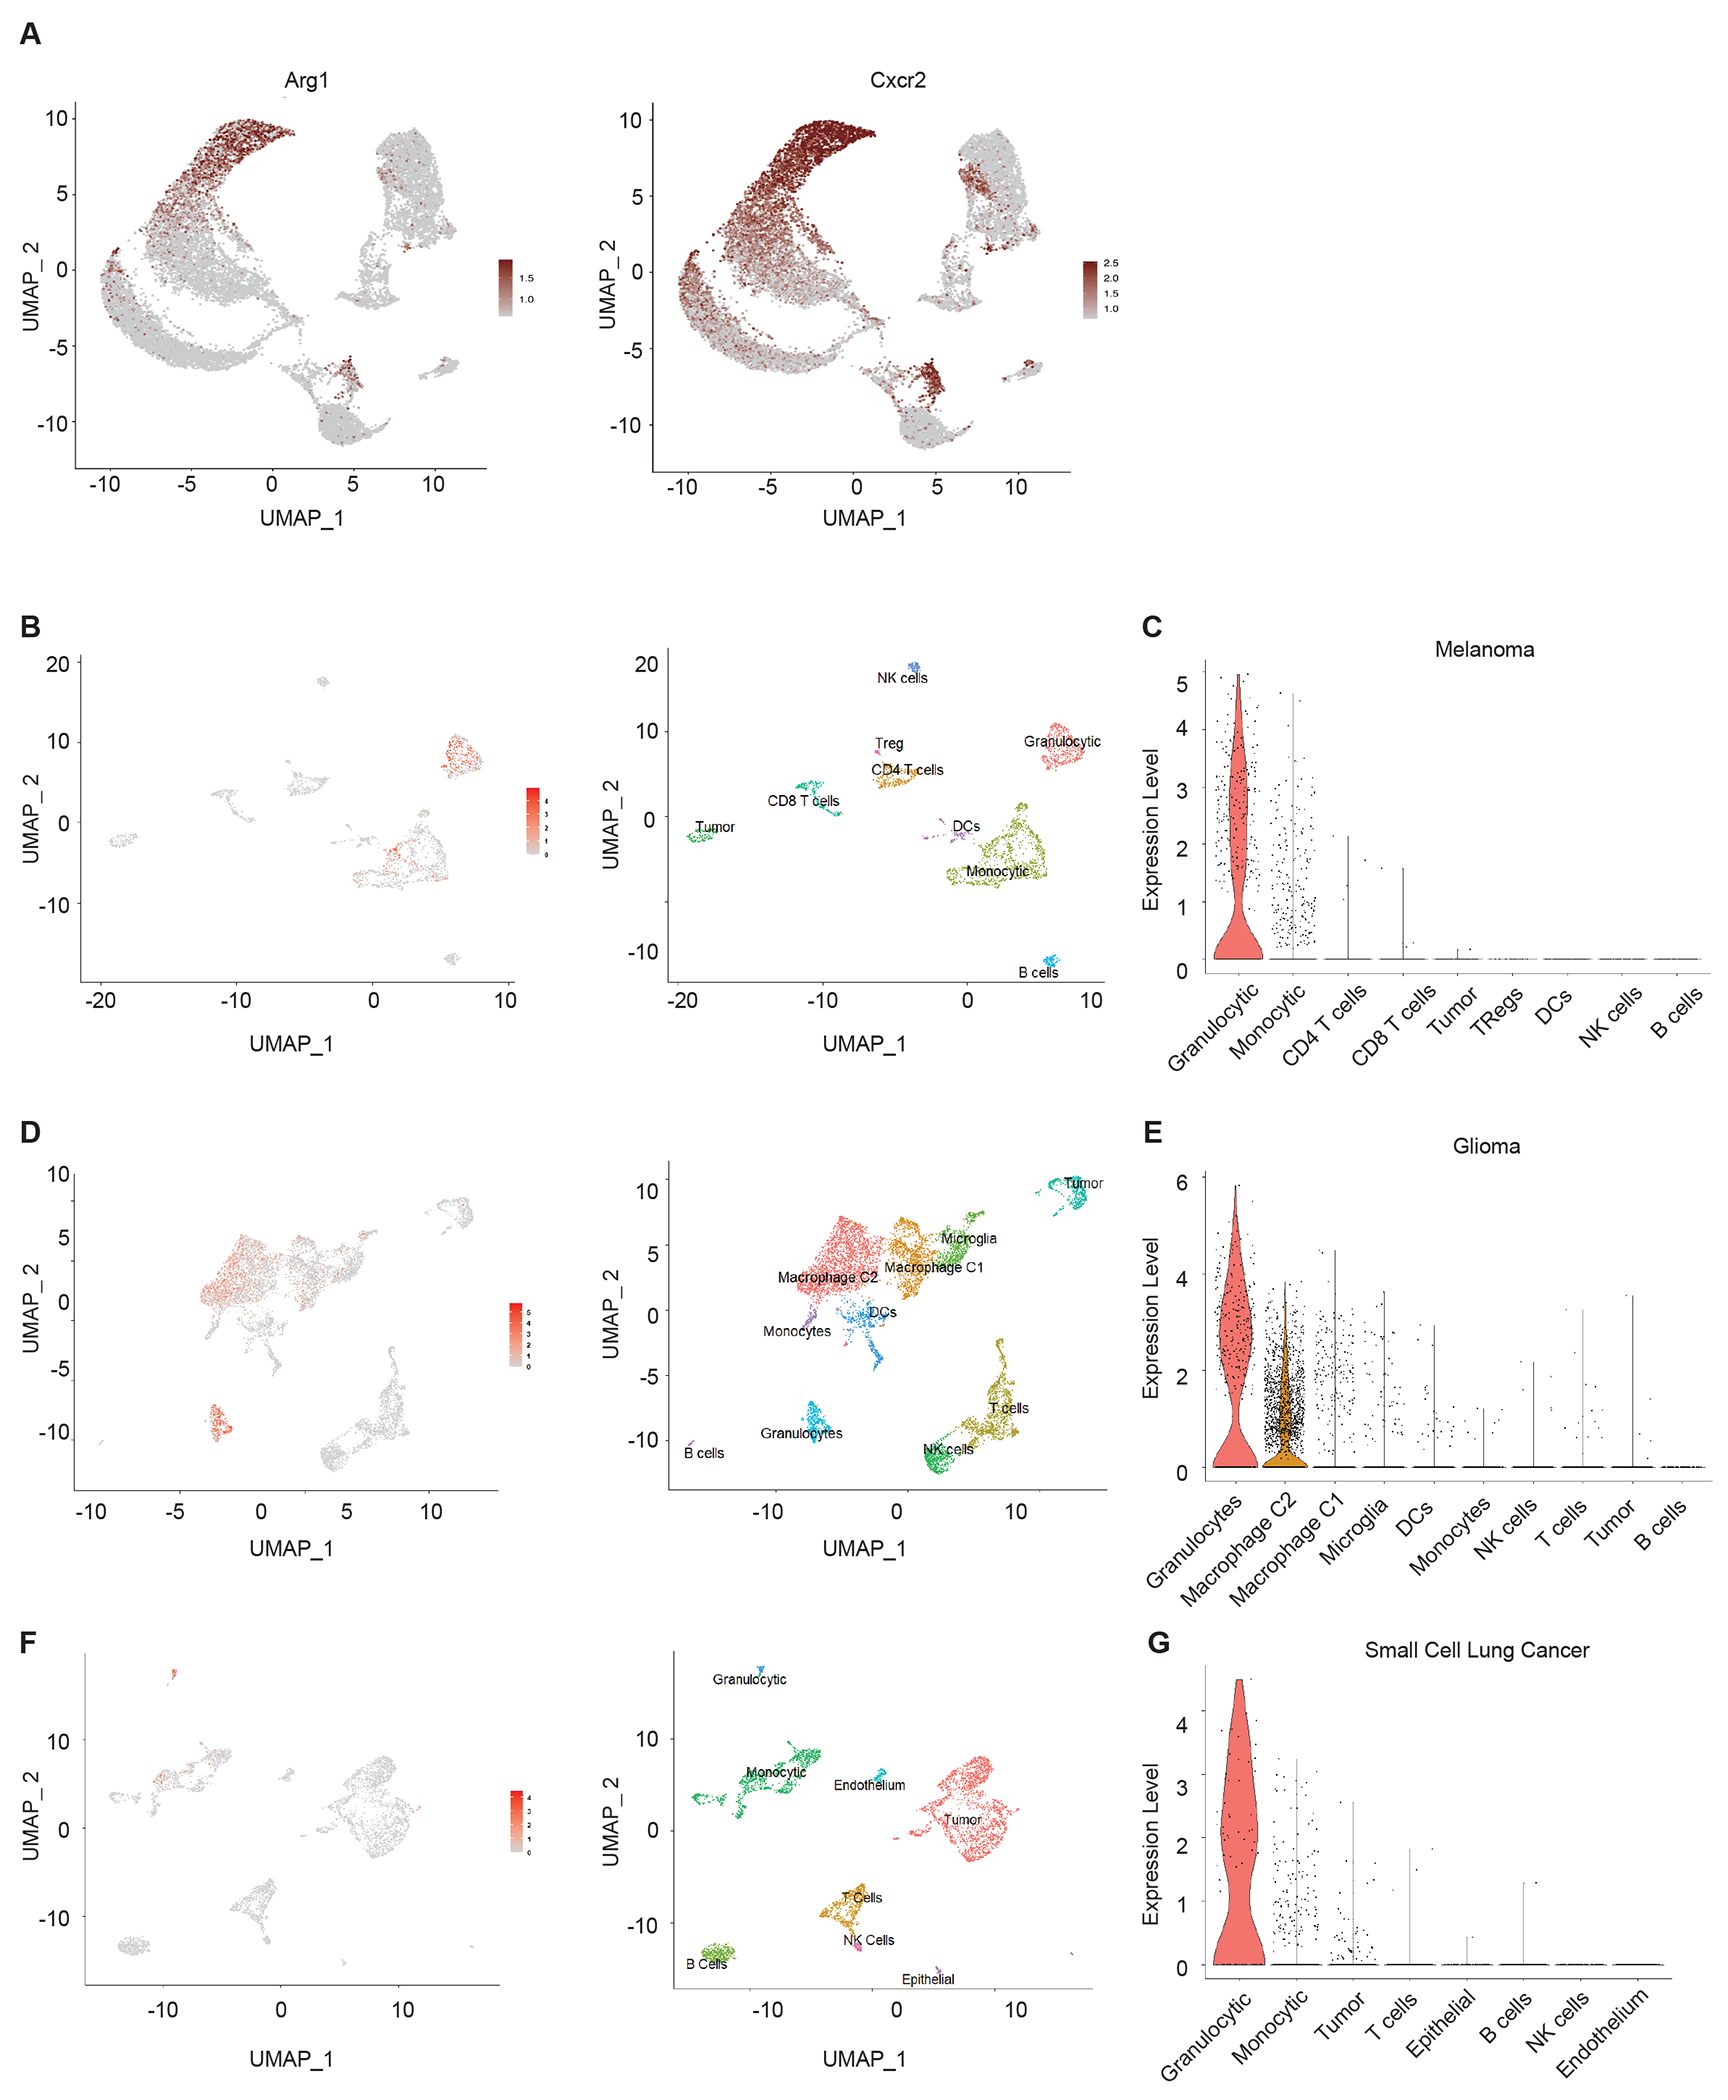
Extended Data Figure 2. Expression of Irg1 is largely confined to granulocytic myeloid populations within the tumors.

Interrogation of publicly available single cell RNA-Seq data analysis to determine cell specific expression of Irg1 within the indicated experimental murine tumors.
(A) UMAP showing cells expressing Arg1 and Cxcr2 in mouse breast cancer tumors shown in Figure 1F.
(B) UMAP showing cells expressing Irg1 in mouse B16F10 subcutaneous injected tumors.
(C) Violin plots showing levels of Irg1 expression in each cluster from mouse B16F10 subcutaneous injected tumors.
(D) UMAP showing cells expressing Irg1 in an oncogenic transgenic glioma mouse model.
(E) Violin plots showing levels of Irg1 expression in each cluster from an oncogenic transgenic glioma mouse model.
(F) UMAP showing cells expressing Irg1 in a mouse small cell lung cancer model.
(G) Violin plots showing levels of Irg1 expression in each cluster from a mouse small cell lung cancer model.
