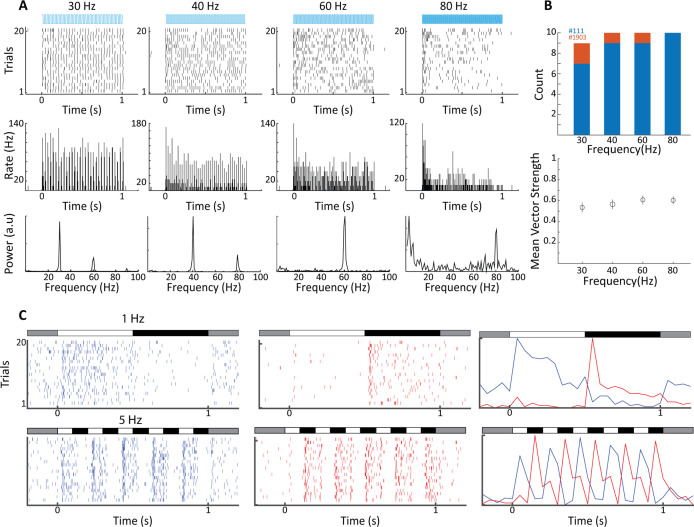
Figure 2. Electrophysiological validation of functional ChR2 expression in lateral geniculate nucleus (LGN) CaMKIIα neurons.
(A) Raster plots (top) show 20 trials of responses of a single LGN neuron in animal #111 to different frequencies of 473 nm blue laser activation. Each vertical bar represents a single spike. Peri stimulus time histograms (PSTHs) (5 ms bin size) and Fast Fourier Transforms (FFTs) of the same spike trains are shown at center and bottom, respectively. For this, cell phase locking disappeared at the highest frequency, 80 Hz. (B) Top shows a histogram of the number of significantly phase-locked neurons, as determined by vector strength, at the four flicker frequencies for two animals (#111 blue, #1903 orange). Bottom is the mean vector strength for the phase-locked neurons at the four flicker frequencies; error bars represent SEM. (C) Raster plots (left and center) and PSTHs (right) reveal both ON- and OFF-type visual responses at sites nearby to laser stimulation for both 1 Hz top and 5 Hz bottom, stimulation frequencies. Bars at the top of each plot indicate the contrast condition, with gray being the background illumination.
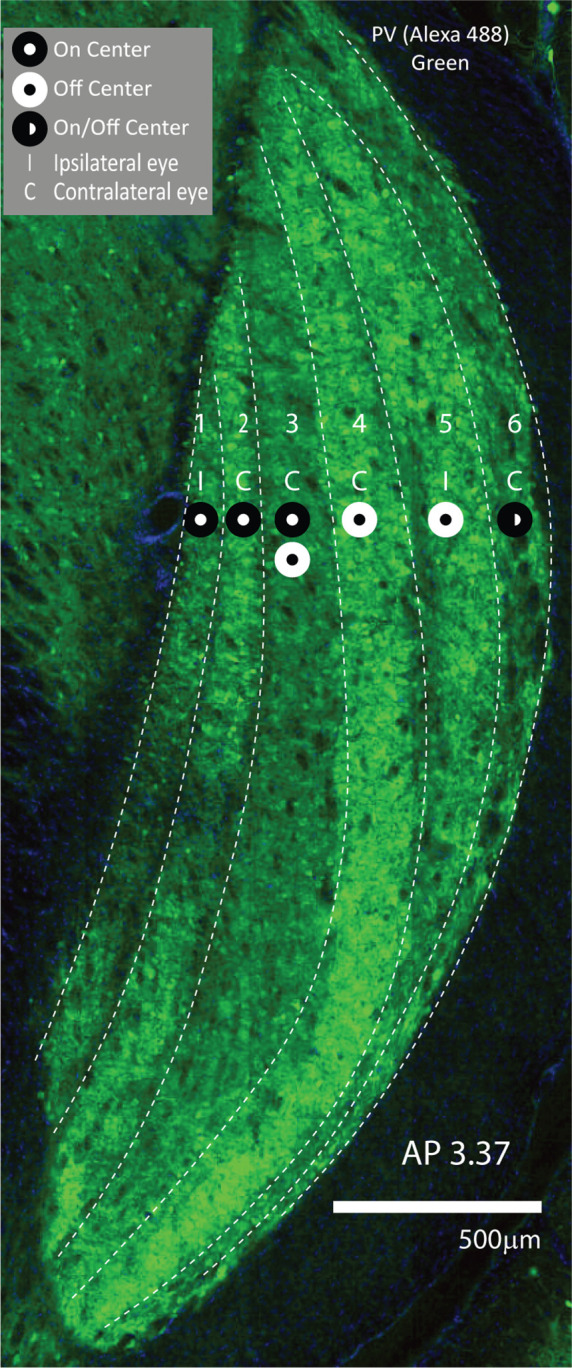
Figure 2—figure supplement 1. Tree shrew lateral geniculate nucleus (LGN), functional organization.


