. 2023 Oct 4;12:e90431. doi: 10.7554/eLife.90431

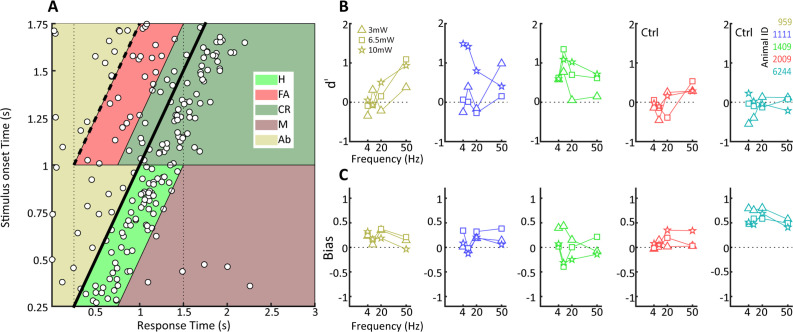
Figure 4. Behavioral detection of optogenetic activation of lateral geniculate nucleus (LGN) CaMKIIα neurons.

(A) As Figure 2B, but for an animal, #1111, detecting blue LED activation of CaMKIIα neurons in the LGN. Note that while the animal can clearly perform the task, detection performance is more variable than for the visual stimulus. (B) d' values at the three LED intensities used are plotted for each animal at four stimulation frequencies (4, 10, 20, and 40 Hz). Ctrl indicates control animals. (C) Same as (B) but for bias scores.

Figure 4.

Figure 4—figure supplement 1. Maximum d’ in visual vs. optogenetic detection.
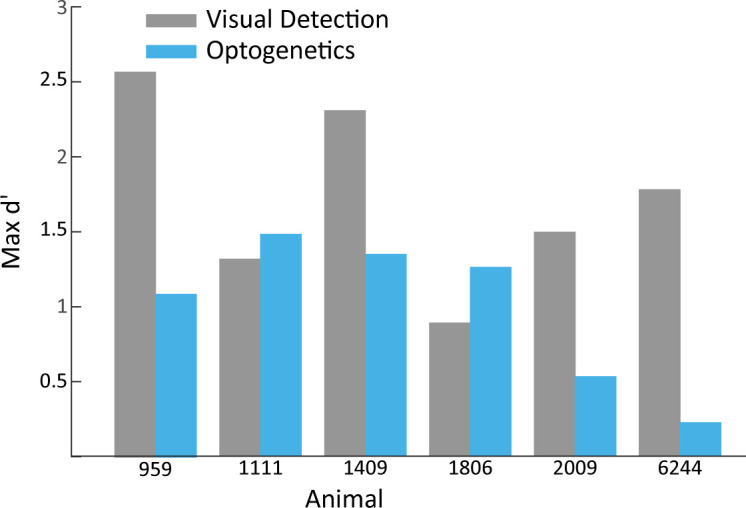
Figure 4—figure supplement 1.

Shown are the maximum d’ values achieved by animals in the visual detection task vs. the optogenetic detection task. Maximum values consider all frequencies and amplitudes used in the optogenetic detection task.
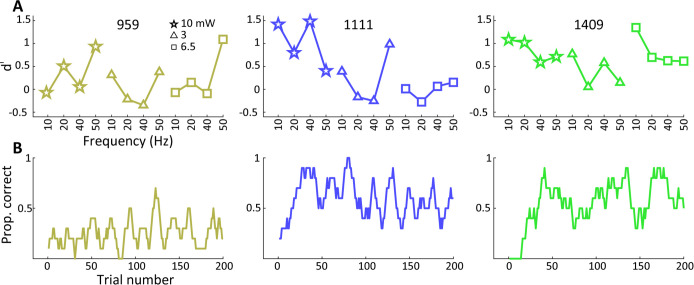
Figure 4—figure supplement 2. Sequence of behavioral training.

Figure 4—figure supplement 2.

(A) Behavioral performance on the optogenetic lateral geniculate nucleus (LGN) detection experiment using multiple frequencies and amplitudes, with results shown in serial order as the daily experiments were conducted in each animal. (B) Performance assessment during the first optogenetic LGN detection experiment (frequency 10 Hz at 10 mW) for each animal. The raw proportion of correct and rewarded trials smoothed by 10 trial convolution is shown including aborted trials. The results reveal that animals 1111 and 1409 tended to readily generalize from previous visual to optogenetic detection, whereas animal 959 showed some evidence of within-session improvement in performance.