
Figure 1. Early-life exposure to low dose penicillin (LDP) and a high fat (HF) diet promotes metabolic dysfunction.
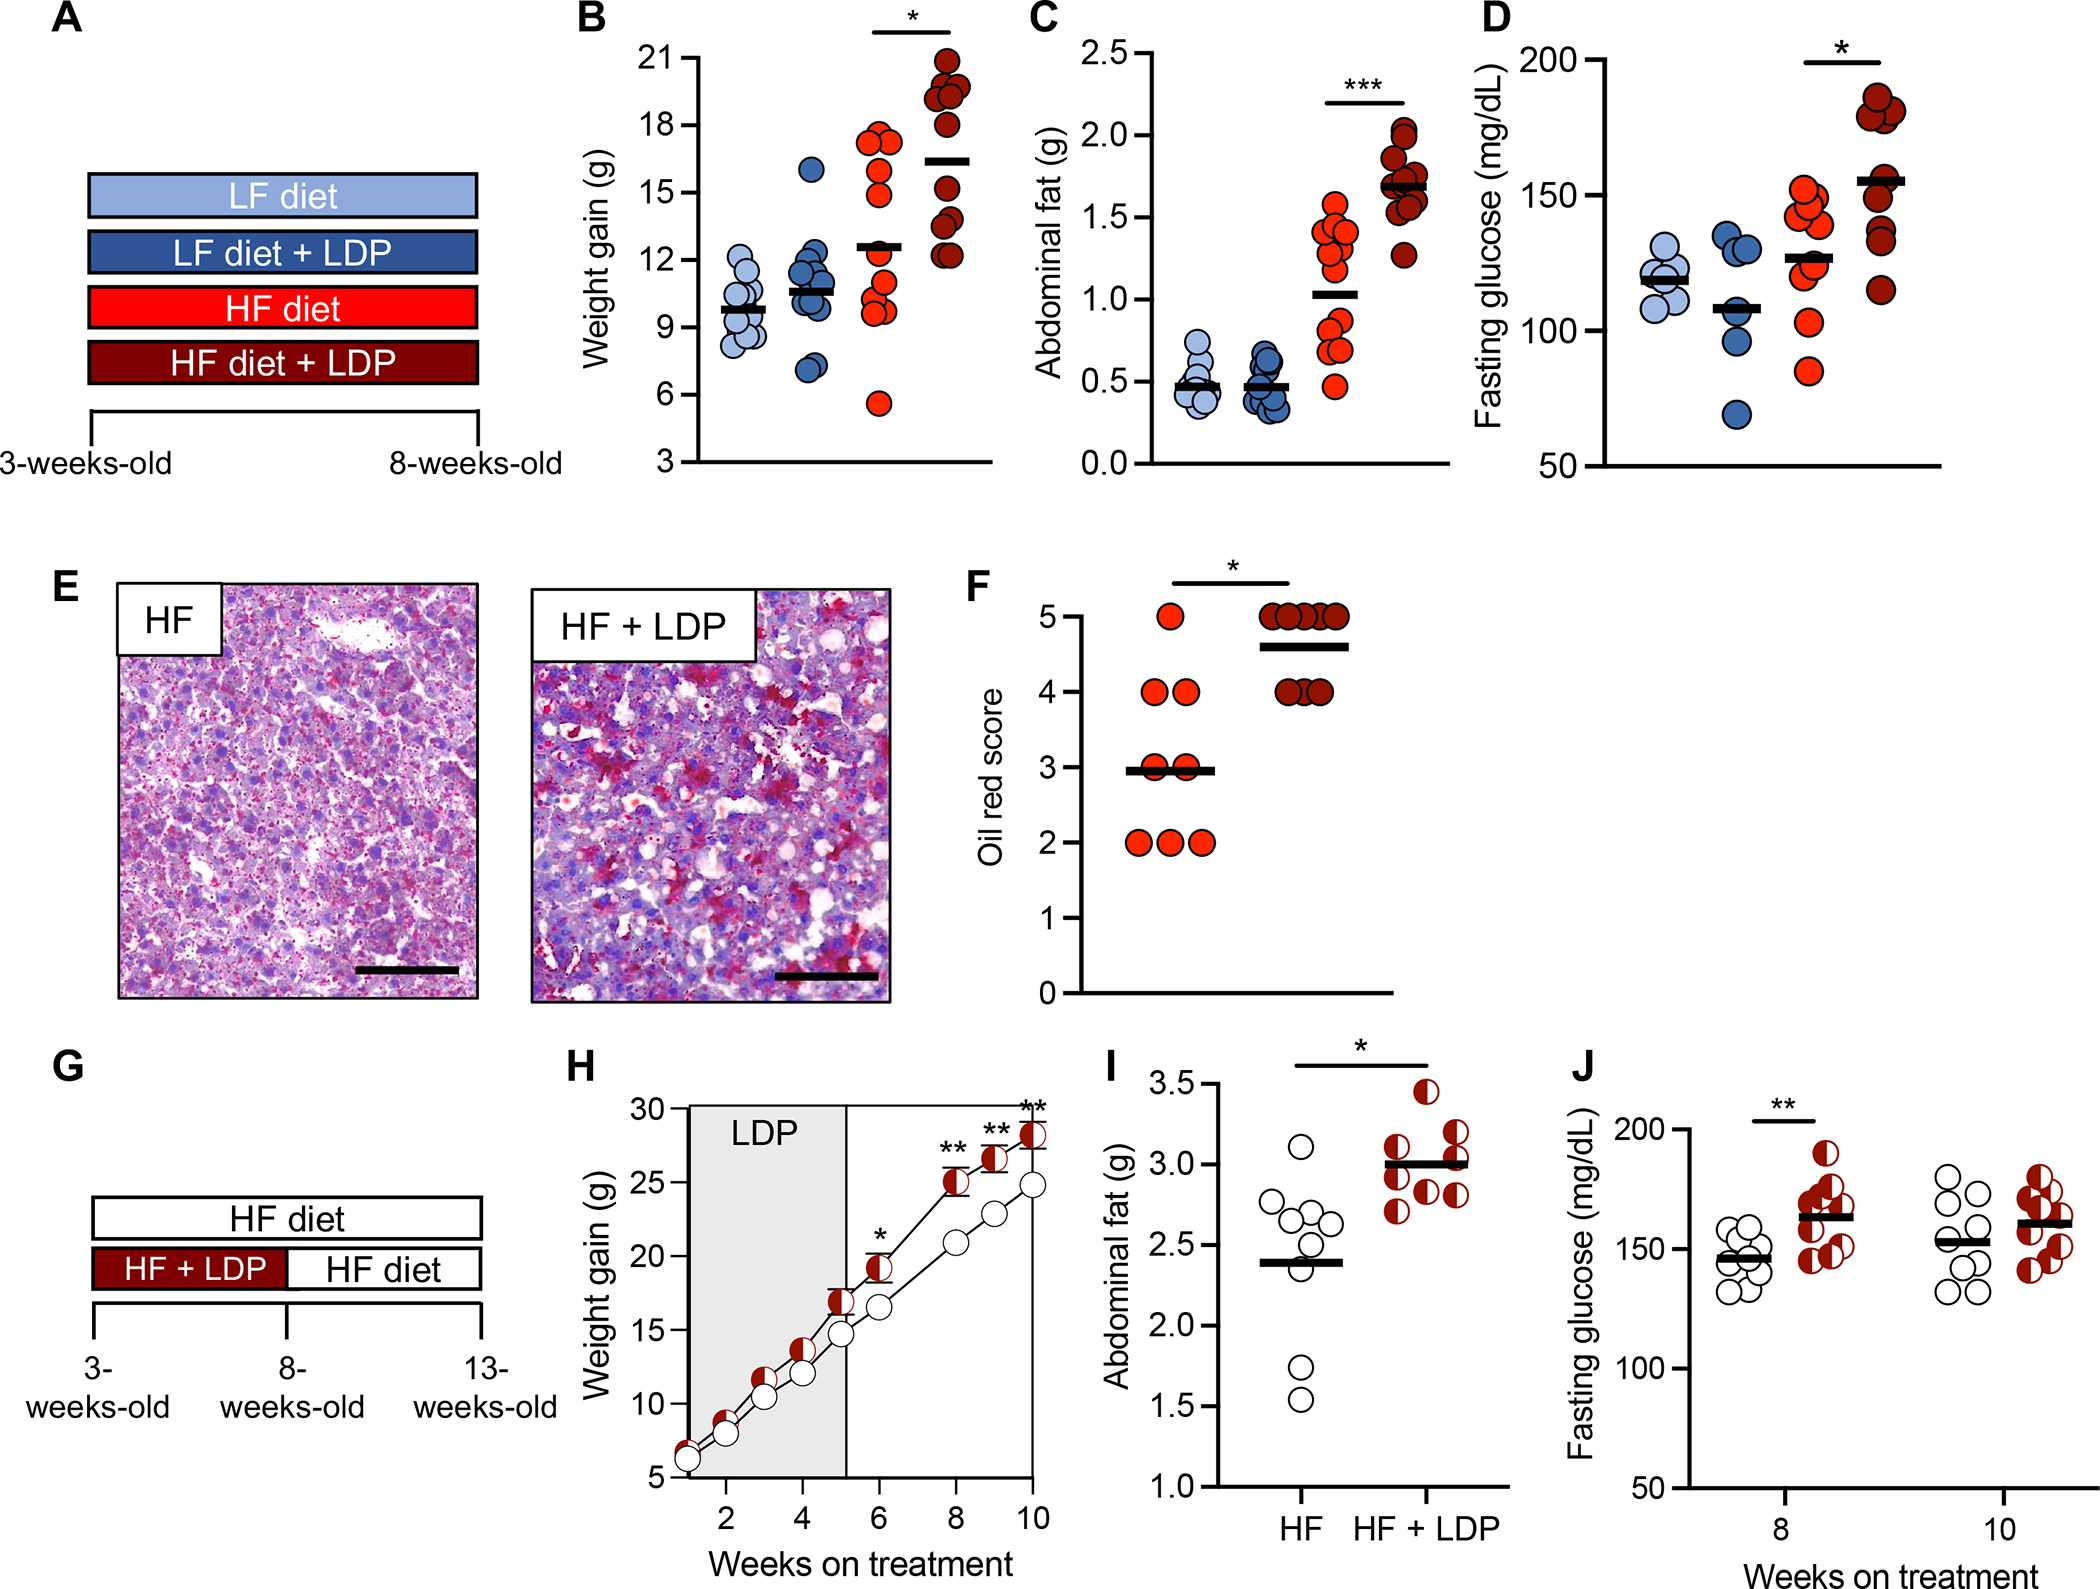
(A, G) Schematics of the experimental models and the groups used. (B) Weight gain, (C) abdominal fat (g), and (D) fasting glucose levels of mice in each group after 5 weeks. (E) Representative images of oil red O-stained sections of liver from HF diet and HF diet + LDP-treated mice. Scale bar represents 100 μm. (F) Combined oil red scores from livers of mice given a HF diet or a HF diet + LDP. (H) Weight gain of mice in each group over the course of the 10-week experiment. (I) Abdominal fat (g) measured after the 10-week diet and antibiotic manipulations. (J) Fasting glucose levels were measured after 8 and 10 weeks on a HF diet. (B – D, F, I, and J) Each dot represents one animal. Bars represent geometric mean. (H) Dots represent mean ± standard error of the mean. (B, C) N = 12 mice/group. Data representative of two independent cohorts (D, F, H – J) N = 9 mice/group. Data representative of one independent cohort. (B-D, I - J) *, p < 0.05; **, p < 0.01; ***, p < 0.005 using an unpaired two-tailed Student’s t test. (F) *, p < 0.05 using Mann-Whitney test. (H) *, p < 0.05; **, p < 0.01 using multiple unpaired two-tailed Student’s t tests.