
Figure 5. Loss of intestinal PPAR-γ signaling promotes increased adiposity due to exposure to LDP and a HF diet.
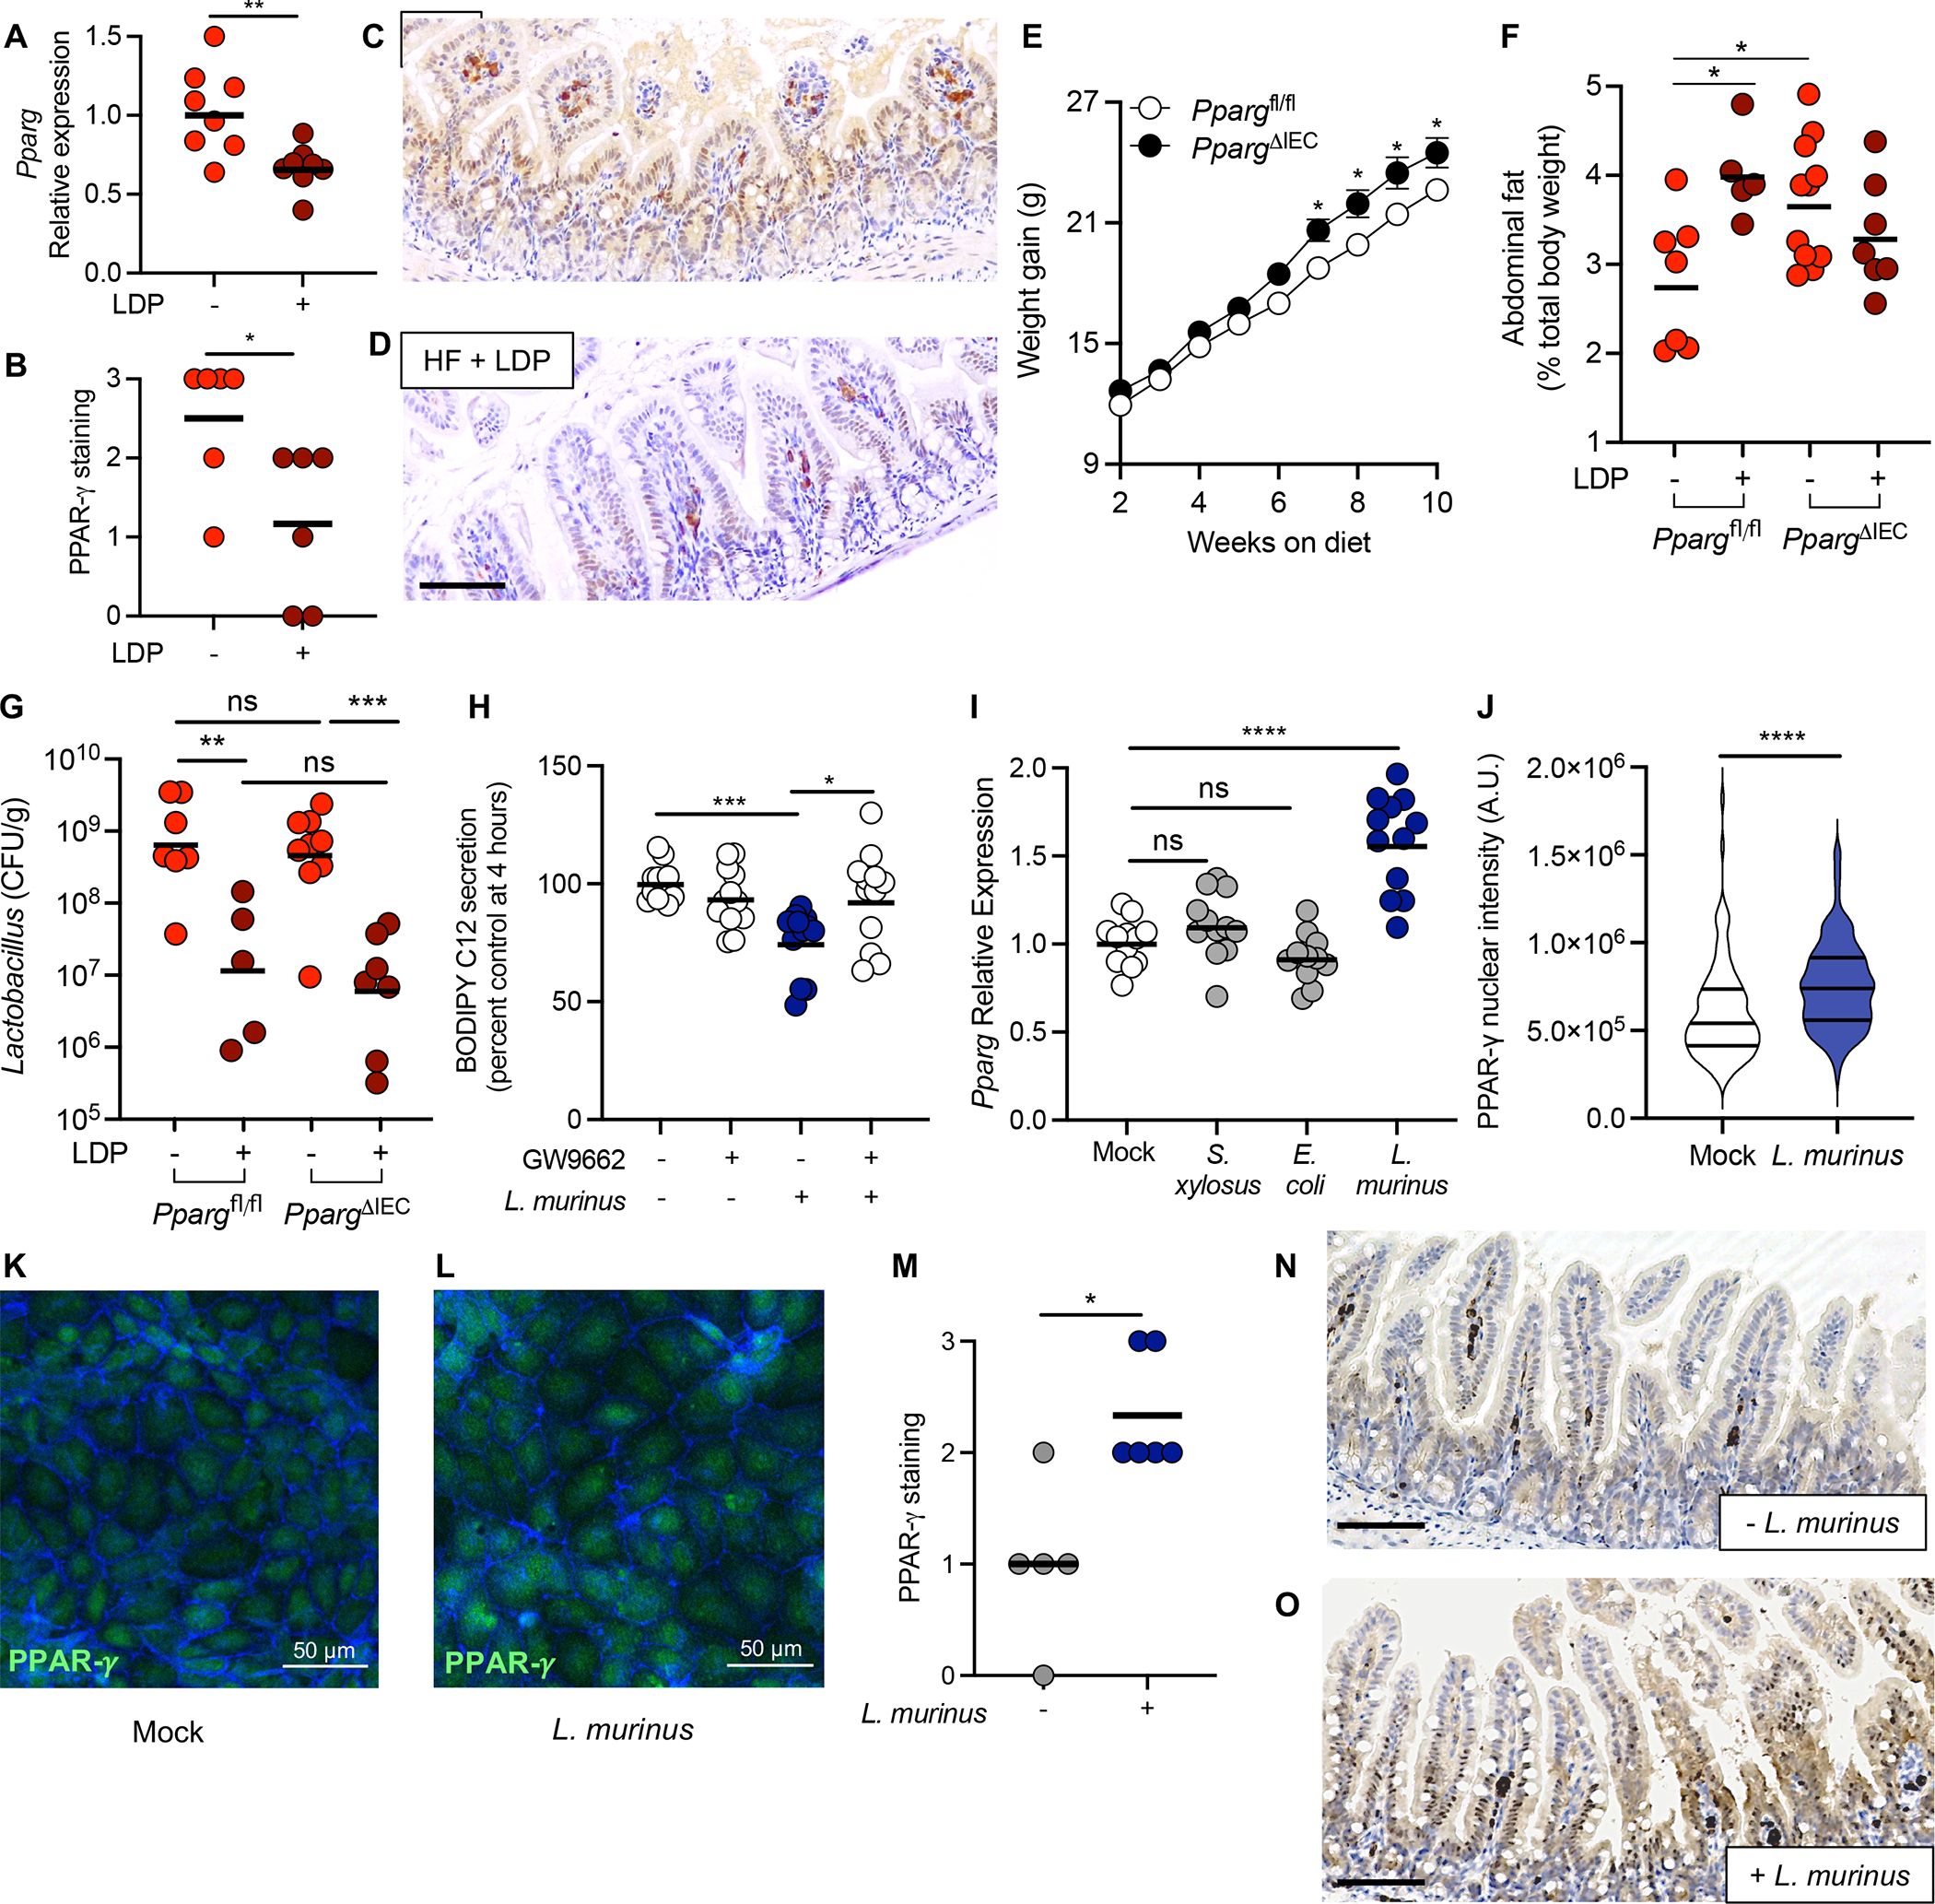
(A) Expression of Pparg in the ileum epithelium of HF diet or HF diet + LDP-treated mice measured by qPCR. (B) PPAR-γ abundance in the epithelium was quantified by scoring stained sections of the ileum. (C – D) Representative images of PPAR-γ staining in HF diet fed mice (C) and HF diet fed + LDP-treated mice (D). Scale bar represents 200 μm. (E) 3-week-old Ppargfl/flVillincre/− mice (PpargΔIEC) and littermate control Ppargfl/flVillin−/− mice (Ppargfl/fl) were fed a HF diet for 10 weeks and weight gain was determined weekly. (F) Abdominal fat (% total body weight) and (G) Lactobacillus abundance (colony forming unit (CFU) / gram) in the small intestine (SI) of PpargΔIEC and Ppargfl/fl measured after the 6-week diet and antibiotic manipulations. (H - L) Intestinal epithelial cells were infected with Ligilactobacillus murinus (L. murinus) at an MOI of 100. (H) Amount of BODIPY C12 secreted by treated Caco-2 cells was measured 4 hours after addition of lipid micelles. (I) Immortalized mouse small intestinal epithelial (MSIE) cells were mock-treated or treated with E. coli Mt1B1, S. xylosus 33-ERD13C, or L. murinus, before expression of Pparg was measured using qPCR. (J - L) MSIE cells were treated with L. murinus (L) or left untreated (K) and incubated for 16 hours. Cells were subsequently stained with anti-PPAR-γ and phalloidin to stain for F-actin. (J) PPAR-γ nuclear intensity was quantified using ImageJ; 15 cells were selected from 2 images from 3 independent experiments. (M - O) Germ-free mice were colonized with a defined microbiota with or without L. murinus and placed on a HF diet for 5 weeks. (M) PPAR-γ abundance in the epithelium was quantified by scoring stained sections of the ileum. Representative images of PPAR-γ staining in mice colonized with (O) or without (N) L. murinus. Scale bar represents 200 μm. (A, F, G) Each dot represents one animal. Bars represent geometric mean. N = 5 – 7 mice/group. (B and M) Each dot represents one animal. Bars represent mean. N = 6 – 7 mice/group. Data representative from one independent cohort. (E) Dots represent mean +/− SEM (N = 8 – 9/ genotype). (H and I) Each dot represents one technical replicate (Data shown from 3 biological replicates). Bars represent geometric mean. (J) Violin plot showing the distribution of PPAR-γ nuclear intensity (n = 90 cells). (A, G, H, I, J) *, p < 0.05; **, p < 0.01; ***, p < 0.001; ****, p < 0.0001 an unpaired two-tailed Student’s t test. (B, M) *, p < 0.05 using a two-tailed Mann-Whitney test. (E) *, p < 0.0332 using a two-way ANOVA with Šídák’s multiple comparisons test. (F) *, p < 0.05 using a one-way ANOVA with Šídák’s multiple comparisons test.