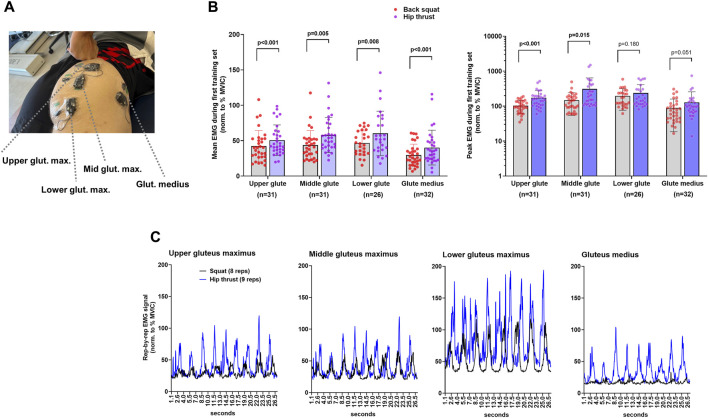
FIGURE 4.
Surface electromyography (sEMG) amplitudes during the back squat and barbell hip thrust. Legend: During the first session, all participants performed both back squats and barbell hip thrusts while we recorded sEMG amplitudes. (A) Representative sEMG electrode placement is depicted on a co-author in panel. (B) Data depict mean (left) and peak (right) sEMG amplitudes during one 10RM set of hip thrusts and one 10RM set of back squats. As 34 participants partook in this test, sample sizes vary due to incomplete data from electrode slippage or distortion. Bars are mean ± SD, and individual participant values are depicted as dots. (C) Representative data from one participant.

