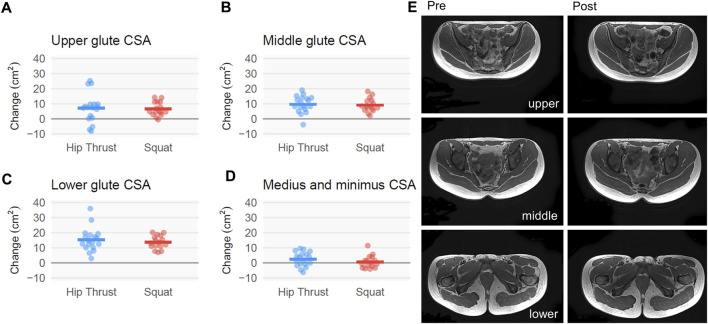
FIGURE 5.
Gluteus musculature mCSA changes following back squat and barbell hip thrust training, assessed using MRI. Legend: Figure depicts change adjusted for pre-intervention scores for MRI-derived muscle cross-sectional area (mCSA). (A) left + right (L + R) upper gluteus maximus, (B) L + R middle gluteus maximus, (C) L + R lower gluteus maximus, and (D) L + R gluteus medius + minimus. Data include 18 participants in the hip thrust group and 16 participants in the back squat group. Graphs contain change scores with individual participant values depicted as dots. (E) Three pre and post representative MRI images are presented from the same participant with white polygon tracings of the L + R upper gluteus maximus and gluteus medius + minimus (top), L + R middle gluteus maximus (middle), and L + R lower gluteus maximus (bottom).

