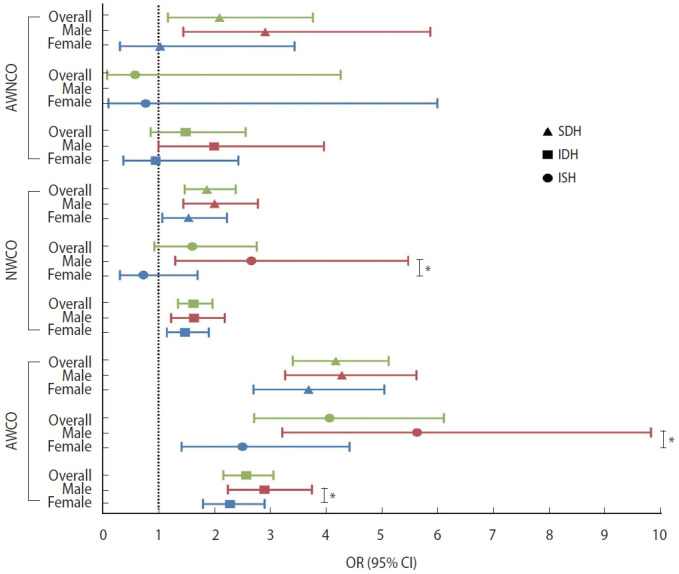
Figure 3.

Forest plot of the associations between obesity phenotypes and hypertension phenotypes in cross-sectional analysis. AWNCO, abnormal weight non-central obesity; NWCO, normal weight central obesity; AWCO, abnormal weight central obesity; SDH, systolic diastolic hypertension; IDH, isolated diastolic hypertension; ISH, isolated systolic hypertension; OR, odds ratio; CI, confidence interval. *p<0.05.
