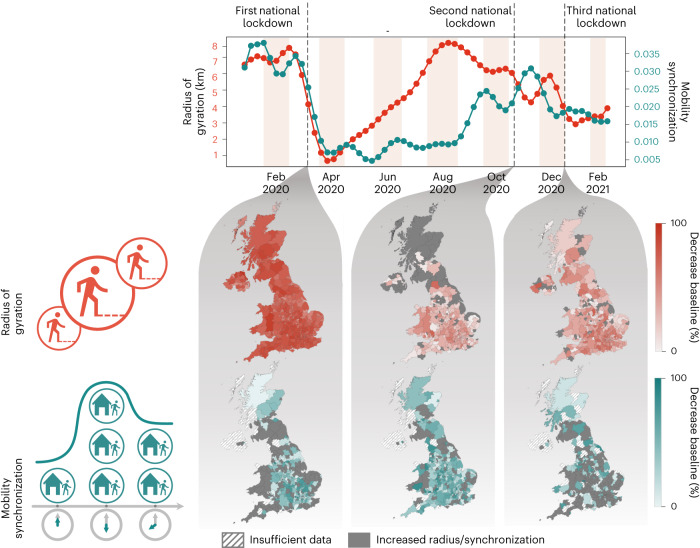
Fig. 1. Evolution of the radius of gyration and mobility synchronization in the United Kingdom’s local authorities from the second week of 2020 to week 7 of 2021.
The maps depict the effects of the three English national lockdowns regarding the spatio-temporal metrics adopted. Note that the first lockdown resulted in the most notable reduction in the radius of gyration in all four nations. However, it is worth mentioning that the first lockdown was the only one with the same restrictions for all of the United Kingdom’s countries. Concerning mobility synchronization, the most notable reduction occurred during the second lockdown. Additionally, it is challenging to disentangle the effects of the third lockdown from the changes in the population mobility patterns caused by end-of-year holidays.

