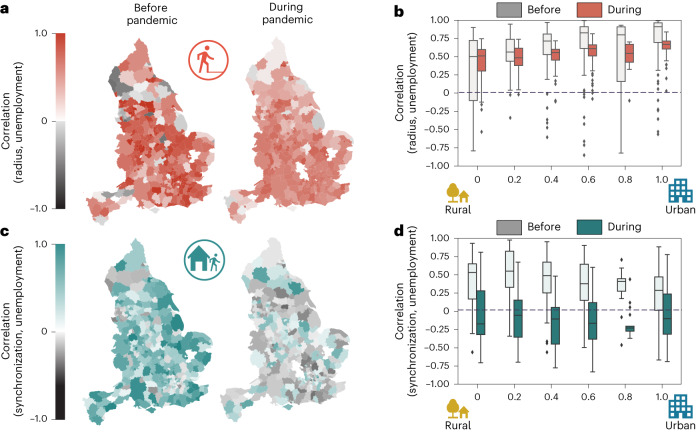
Fig. 3. Correlation between the spatio-temporal metrics of human mobility and the unemployment claimant count.
a, The correlation between the radius of gyration of the English local authorities (N = 316 English local authorities) is depicted in before and during the pandemic. b, The correlation when the local authorities are grouped by level of urbanization also before and during the pandemic. c, The correlation between mobility synchronization with the unemployment claimant count of the English local authorities (N = 316 English local authorities) for the periods before and during the pandemic (N = 316 English local authorities). d. The results grouped by urbanization level. We define the period before the pandemic from April 2019 to February 2020. The pandemic period considered was from April 2020 to February 2021. In b and d, boxes that span from the 25th percentile (Q1) to the 75th percentile (Q3), with median values (50th percentile) represented by a central line. The minimum and maximum values are determined by subtracting 1.5 times the interquartile range (IQR) from Q1 and adding 1.5 times the IQR to Q3, respectively. Notice that, before the pandemic, both the radius and the synchronization positively correlated with the unemployment claimant count. However, during the pandemic, the correlation with the radius became less strong, and that with synchronization became negative. It is also worth mentioning that b and d reveal a possible association between correlation changes and areas' urbanization level.

