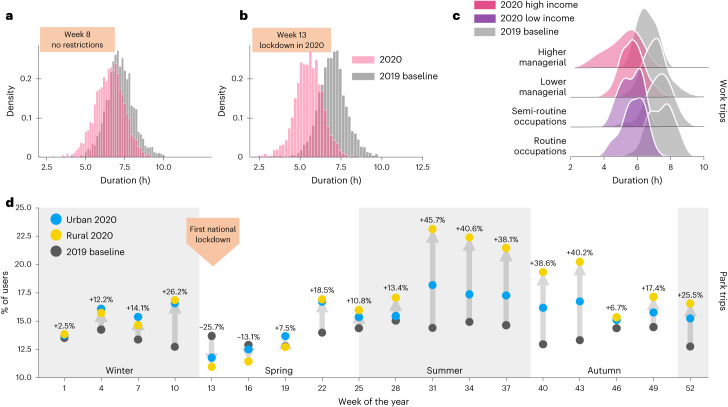
Fig. 5. Changes in the number and duration of trips.
a,b, The differences between the duration of work-related trips for 2 weeks in 2019 and 2020. During week 8 (a), there were no mobility restrictions in 2020, and we can see that the distributions are similar. In contrast, week 13 (b) was the first week of the first lockdown, and we can see more differences in the distributions of 2019 and 2020. c, The differences across different socio-economic groups during week 13. d, The differences in the number of trips to green spaces such as parks in 2020 compared with the baseline year of 2019. Note that, in this case, the local authorities are grouped in urban and rural groups.

