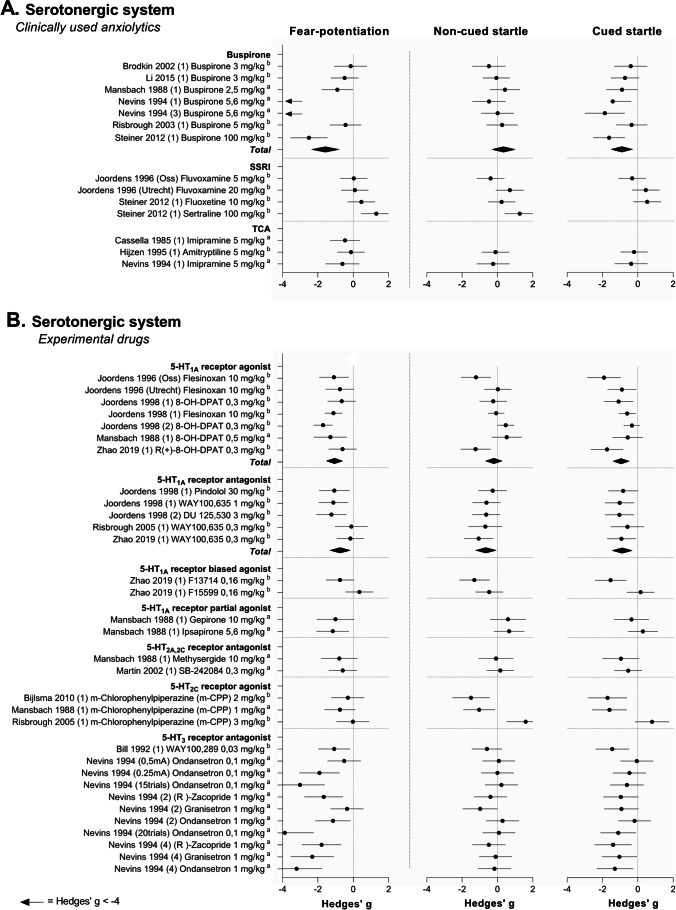
Fig. 5.
Forest plots of the effects of clinically used anxiolytics (A) and experimental (B) serotonergic drugs on fear potentiation (left), non-cued baseline startle response (middle), and the response to cued startle trials (right). Pooled effect sizes, shown as Total, were calculated per drug class. If data were insufficient to conduct a meta-analysis, data were grouped but not pooled. Data are shown as Hedge’s g and 95% confidence intervals. Fear potentiation represents a = difference score, b = calculated difference score, c = % fear-potentiated startle

