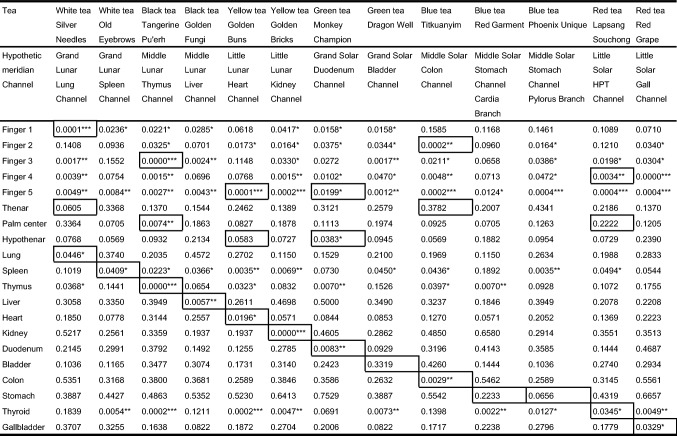
Table 2.
The top significance p value of temperature variation in each surface area of the body after drinking different kinds of tea
The data in the boxes are expected to be significant according to the TCM meridian hypothesis. The significant value makers are as follows, *p < 0.05, **p < 0.01, ***p < 0.001. The data outside the boxes are the top p values of the corresponding tea comparing to those of other tea, excluding the expected significant tea. Most of the significance values match the hypothesis, except for white tea and blue tea in thenar area, red tea in palm center, yellow tea in hypothenar area, green tea above bladder, and blue tea above stomach

