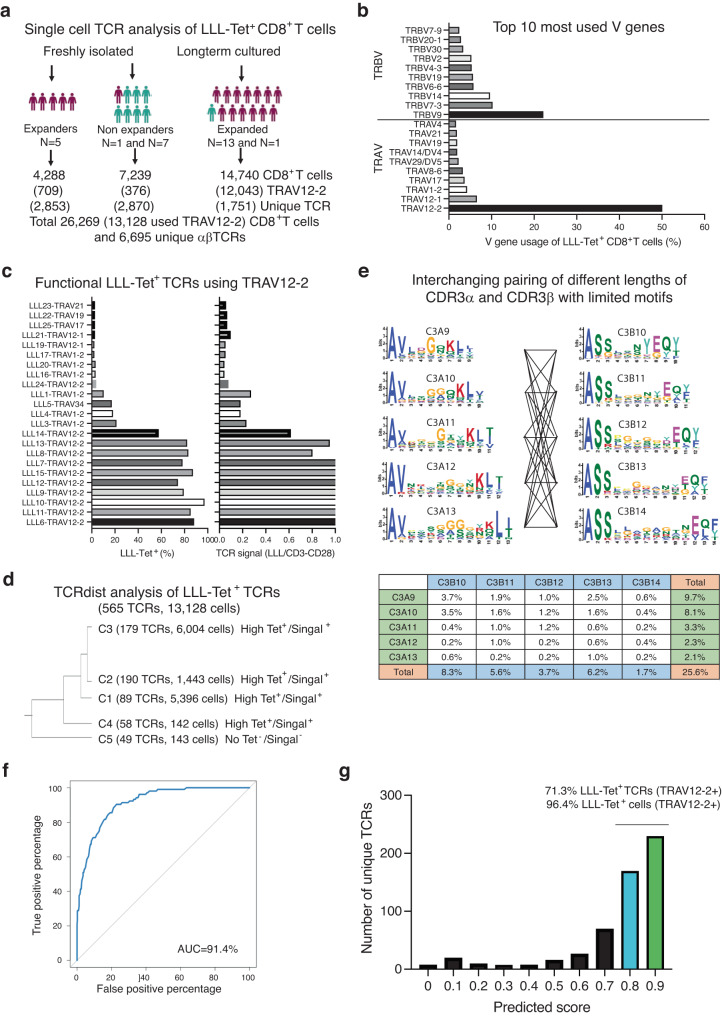
Fig. 5. Characteristics of TCRs and their predictability of binding to a dominant nucleocapsid LLL epitope.
a Summary of LLL tetramer+ CD8+ T cells isolated from uninfected, COVID-19 convalescent donors, and in vitro expanded donors by cell sorting and scTCR-seq. b Top ten most used V genes of LLL+ CD8+ T cells. Histogram depicting the top ten most used V-genes (Vα and Vβ) in all LLL+ CD8+ T cells. c Validation of LLL-HLA-A2 binding and signaling of cloned selected LLL+TCRs. Tetramer binding percentage and LLL-HLA-A2 stimulation induced signaling presented by the ratio of GFP% induced by LLL-HLA-A2 over anti-CD3/CD28 stimulation post 4 h. d Classification of LLL-TCRs using TRAV12-2 by TCRDist. Dendrogram of clusters of LLL-TCR (TRAV-12-2) (N = 575 with percentage of each cluster) defined by TCRDist. Cluster 1,2,4 and 5 containing confirmed LLL-TCRs (N = 524) while cluster 3 did not (N = 51). e CDR3α and CDR3β motifs and their pairings of cluster 2. Motifs of each CDR3 length were generated by MEME Suite 5.5. The percentages of each combination between a CDR3α and a CDR3β motif in total number of LLL-TCRs (TRAV12-2) are presented. f Machine learning (ML) algorithm for predicting LLL-HLA-A2 binding TCRs. ROC of the predictive ability on unexposed testing TCRs of the ML algorithm for LLL-HLA-A2 TCR binding is 92.2%. g Proportion of ML predicted LLL-HLA-A2 binding TCRs in unique LLL+ TCRs (TRAV12-2) and total LLL+ (TRAV12-2) CD8+ T cells. The percentages of ML predicted LLL+ TCRs with scores greater than 0.8 are shown in unique LLL+ TCRs (TRAV12-2) and in total LLL+ (TRAV12-2) CD8+ T cells.

