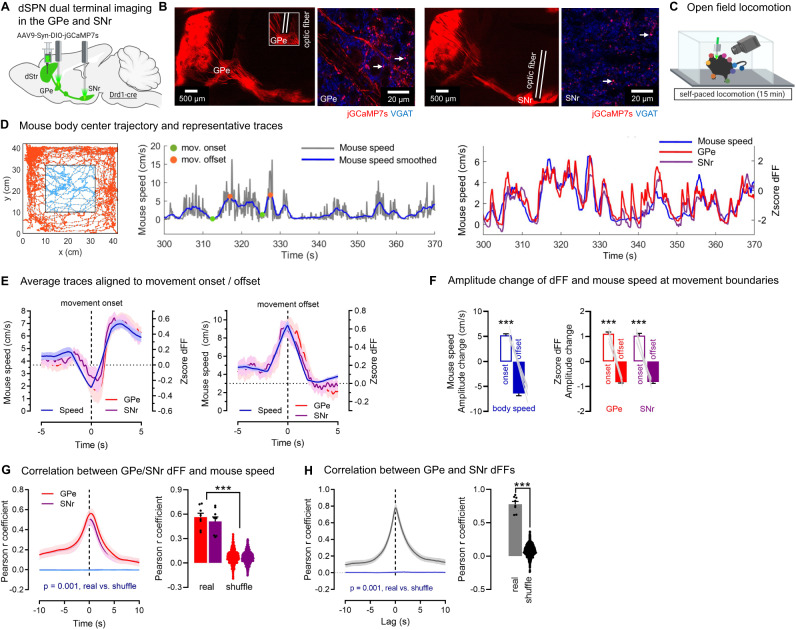
Fig. 2. dSPNs send copies of motor signals to GPe and SNr axons, continuously encoding body speed.
A Strategy for dual calcium recordings with fiber photometry of direct pathway striatal projection neuron (dSPN) terminals in the globus pallidus externus (GPe) and substantia nigra reticulata (SNr) arising from neurons in the dorsomedial section of the dorsal striatum (dStr) using the calcium indicator jGCaMP7s. B jGCaMP7s (red) colocalizes with the GABA presynaptic marker VGAT (blue) in the GPe and SNr, appearing pink (white arrows). Optic fibers target GPe and SNr jGCaMP7s+ regions. C Mice are video-recorded in the open field and body positions obtained with DeepLabCut. D Left: Representative body trajectory. Middle: Representative trace of mouse speed over time (raw data: gray; smoothed in 2 s bins: blue), showing the onset (green) and offset (orange circle) of motor bouts. Right: dSPN GPe and SNr calcium signals (Zscore of the normalized fluorescence, i.e., deltaF/F; dFF) closely track mouse speed. E Average data aligned to the onset and offset of individual motor bouts. GPe and SNr dFF show increases at movement onset and decreases at movement offset. F Body speed (two-sided paired t-test ***p < 0.001) and GPe/SNr dFF (ANOVA: main effect: ***p < 0.001) significantly increase at movement onset vs. offset. G GPe (r = 0.56) and SNr (r = 0.51) dFF significantly correlate with mouse speed when compared to phase-shuffled data (N = 1000 iterations) (two-sided Mann–Whitney GPe ***p = 0.001, SNr ***p = 0.001). Real data: black dots show individual mice; shuffle data: colored dots show individual shuffled data. H GPe and SNr dFF are highly correlated with each other (Pearson r = 0.78) vs. phase-shuffled data (N = 1000 iterations) (two-sided Mann–Whitney ***p = 0.001). Real data: black dots show individual mice; shuffle data: black dots show individual shuffled data. N = 8 mice for all panels. Exact p-values are given in Supplementary Dataset S2. Data are mean ± SEM. Source data are provided as a Source Data file.

