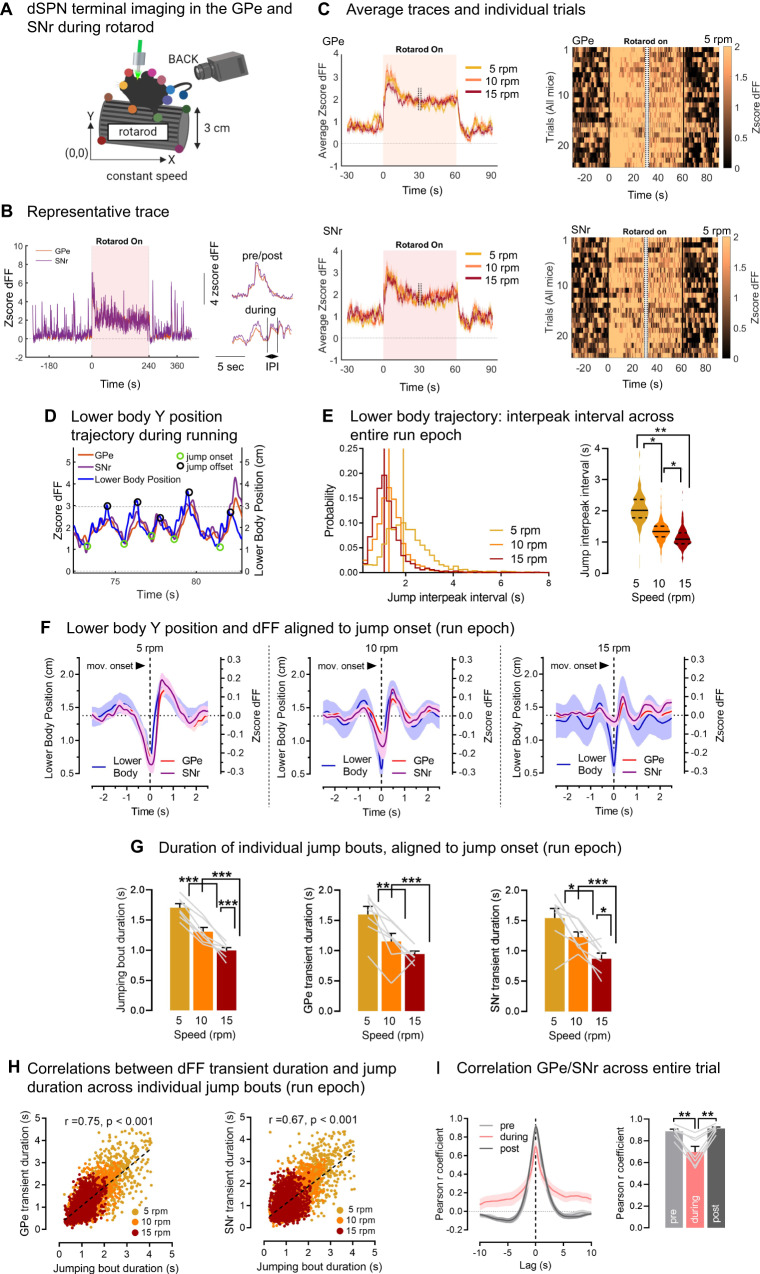
Fig. 3. dSPN GPe and SNr axons track the temporal boundaries of individual motor bouts.
A Globus pallidus externus (GPe) and substantia nigra reticulata (SNr) direct pathway striatal projection neuron (dSPN) axonal recordings using the calcium indicator jGCaMP7s. Mice are video-recorded in the rotarod set at constant speeds. Body part positions are obtained with DeepLabCut. B Representative trace of GPe/SNr zscored normalized fluorescence, i.e., deltaF/F (dFF), with zoom-in view (left inlet). IPI: interpeak interval. C Average GPe/SNr dFF traces at increasing speeds (left) and heatmaps of all individual trials at 5 rounds per minute (rpm) (3/animal) (right) showing sustained activity across the running epoch. Only the first/last 30 s of the rotarod epoch is shown (cut-off = dashed lines). D Representative trace of mouse lower body position on the Y axis during running, showing the onset (green) and offset (black circle) of jumping bouts. dSPN GPe and SNr dFF closely track lower body Y trajectory. Dashed lines show lower (0 cm) and upper (3 cm) bounds of the rotarod. E Left: Probability distributions of jump IPIs. Maximal probability (vertical bar) is reached at smaller IPIs as the rotarod speed increases. Right: Jump IPI averaged per animal significantly decreases as the rotarod speed increases (ANOVA: speed: p < 0.01; Tukey post-hocs: *p < 0.05 or **<0.01). F Average data aligned to the onset of individual jump bouts during running. GPe and SNr dFF increases at jump onset, showing shorter and smaller transients with increasing rotarod speed. G Duration of jumping bouts (peak-to-peak) and duration of GPe/SNr dFF transients (peak-to-peak) significantly decrease with rotarod speed (all: ANOVA: speed: p < 0.01, Tukey post-hocs: *p < 0.05, **<0.01, ***<0.001). H Duration of individual jumping bouts significantly correlate with duration of individual GPe/SNr dFF transients (Pearson r, all p < 0.001: duration: GPe: r = 0.75; SNr: r = 0.67). I Pearson correlation between GPe and SNr activity decreases in a task-dependent manner between rest (pre/post: r = 0.90) and running (r = 0.70) (ANOVA: epoch: p < 0.01, post-hoc: **p < 0.01). N = 7 mice for all experiments. Data are mean ± SEM. Exact p-values are given in Supplementary Dataset S2. See also Supplementary Figs. S4, S5. Source data are provided as a Source Data file.

