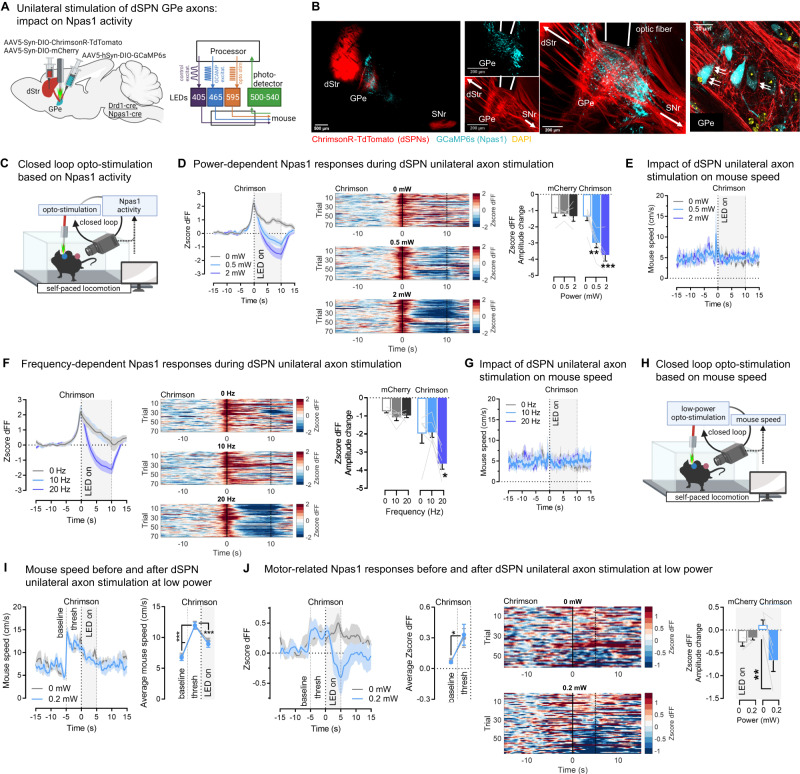
Fig. 8. dSPN axons inhibit ongoing motor-related calcium dynamics in their GPe Npas1 target neurons.
A Left: Optogenetic stimulation of direct pathway striatal projection neuron (dSPN) axons in the globus pallidus externus (GPe) using the opsin ChrimsonR; simultaneous recording of Npas1 activity using the calcium indicator GCaMP6s. dStr dorsal striatum. Right: All-optical setup. B ChrimsonR-TdTomato+ dSPN terminals in the GPe (red) apposed to (white arrows) GCaMP6s+Npas1 somas (cyan). Optic fibers in the same region. Representative from N = 6 mice. C Opto-stimulation is triggered in a closed-loop when Npas1 dFF surpasses a defined threshold (see Methods). D 10 s, 20 Hz stimulation of dSPN GPe axons leads to a power-dependent reduction in Npas1 activity. Left: Average traces, Middle: Heatmaps of all trials, Right: Amplitude change in Npas1 dFF in the opto-window (ANOVA: virus x power p < 0.001; Sidak post-hoc: Chrimson **p < 0.01, ***<0.001, mCherry p > 0.8). E As expected: no effect of unilateral stimulation on mouse speed (ANOVA: power p = 0.50). F 10 s, 2 mW stimulation of dSPN GPe axons leads to a frequency-dependent reduction in Npas1 activity. Left: Average traces, Middle: Heatmaps of all trials, Right: Amplitude change in Npas1 dFF in the opto-window (ANOVA: virus x power p < 0.01; Sidak post-hocs: Chrimson: 0 vs 20 Hz *p < 0.05, 0 vs 10 Hz p = 0.99, mCherry p = 0.28 and 0.51). G No effect of stimulation on mouse speed (ANOVA: power p = 0.56). H Opto-stimulation triggered in a closed-loop during ongoing locomotion when mouse speed reaches a defined threshold (see Methods). I As expected, mouse speed increases before the opto-trigger (baseline vs. threshold (thresh) and stim periods), but is not affected by opto-stimulation (0 vs. 0.2 mW) (ANOVA: epoch p < 0.001, epoch x LED p = 0.79; Sidak post-hocs all ***p < 0.001). J 5 s, 20 Hz stimulation of dSPN GPe axons at ultra-low power (0.2 mW) reduces motor-related Npas1 activity. Left: Average and summary data showing a significant increase in dFF before the opto-trigger (ANOVA: epoch p < 0.05). Middle: Heatmaps of all trials, Right: Amplitude change in Npas1 dFF in the opto-window (ANOVA: virus x LED p < 0.01; Sidak post-hocs: Chrimson **p < 0.01, mCherry p = 0.84). Heatmaps: straight/dashed line = LED onset/offset. N = 5 mCherry, N = 6 ChrimsonR throughout. Data are mean ± SEM. Exact p-values are given in Supplementary Dataset S2. See also Supplementary Fig. S9. Source data are provided as a Source Data file.

