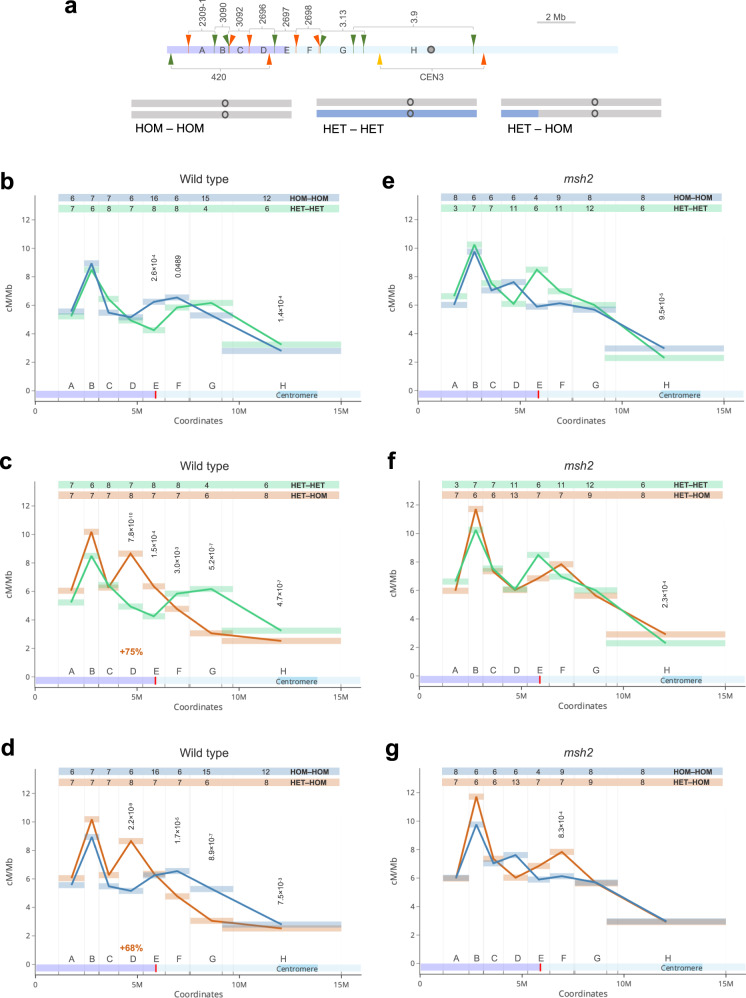
Fig. 5. Crossover distribution across the chromosome arm in response to polymorphism.
a (upper panel) Location of eight FTL intervals across the Arabidopsis chromosome 3 shown in addition to 420 and CEN3 intervals. Fluorescent reporters are indicated by tick marks and arrowheads with colours corresponding to eGFP (green), dsRed (red) and eYFP (yellow). Capital letters ‘A’ – ‘H’ were used instead of the original FTL names (indicated on the top), for simplicity. The violet and light blue shading represents ‘HET’ and ‘HOM’ regions in HET-HOM line, respectively. Genetically defined centromere95 is indicated as grey circle. (lower panel) Ideograms of chromosome 3 showing heterozygosity pattern in lines used in (b–g). Grey corresponds to Col while blue corresponds to Ct genotype. b–d Comparison of mean crossover frequency (cM/Mb) in eight intervals along the chromosome arm in inbred (HOM-HOM) vs. hybrid (HET-HET) (b), hybrid vs. recombinant line (HET-HOM) (c) and inbred vs. recombinant line (d). Rectangles represent the length of the intervals, interval names as in (a). The numbers of individuals used to calculate the means are indicated at the top and highlighted in the colour corresponding to the given genotype. One-way ANOVA with Tukey HSD was used to calculate statistical significance. Not significant values were not shown. The relative percentage increase in the interval D crossover frequency is indicated in red. e–g As in (b–d), but for the msh2 mutant. Source data are provided as a Source Data file.

