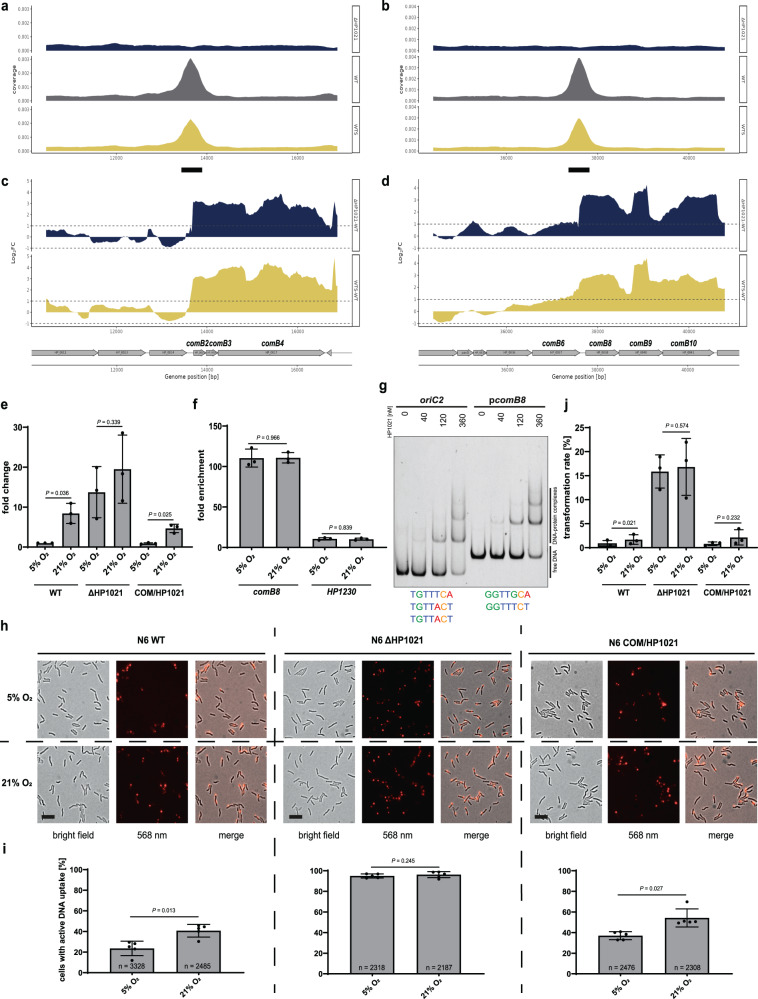
Fig. 2. HP1021 controls the expression of comB2-comB4 and comB6-comB10 gene clusters and DNA uptake.
a, b ChIP-seq data profiles. Read counts were determined for H. pylori N6 WT, WTS, and ΔHP1021 strains. y-axis, the coverage of the DNA reads; x-axis, the position of the genome; a thick black line under the x-axis, the main peak of the binding site. c, d RNA-seq data profiles. The genomic locus for H. pylori N6 WT, WTS, and ΔHP1021 strains with the WTS-WT and ΔHP1021-WT expression comparison; values above the black dashed lines indicate a change in the expression of |log2FC | ≥ 1; FDR ≤ 0.05. e RT-qPCR analysis of the transcription of comB8 in H. pylori N6 cultured under microaerobic and aerobic conditions. The results are presented as the fold change compared to the WT strain. f ChIP fold enrichment of DNA fragment in comB8 by ChIP-qPCR in H. pylori N6 cultured under microaerobic and aerobic conditions. The HP1230 gene was used as a negative control not bound by HP1021. g EMSA analysis of HP1021 binding to the pcomB8 region in vitro. EMSA was performed using the FAM-labeled DNA fragments and recombinant Strep-tagged HP1021. The oriC2 DNA fragment was used as a control. The HP1021 boxes are shown below the gel image. h Analysis of DNA uptake by H. pylori N6. Bright field, fluorescent, and merged images of H. pylori WT and mutant strains after 15 min of Cy3 λ DNA uptake under microaerobic and aerobic conditions. The scale bar represents 2 µm. i Quantitative analysis of λ-Cy3 DNA foci formation in H. pylori under microaerobic and aerobic conditions. j Analysis of HP1021 influence on transformation rate in H. pylori N6 using the rpsL casette in H. pylori N6 WT and mutant strains under microaerobic and aerobic conditions. e, f, i–j Data have depicted as the mean values ± SD. Two-tailed Student’s t-test determined the P value. e, f, j n = 3 biologically independent experiments. i n = number of cells examined over 5 independent biological experiments. g, h Digital processing was applied equally across the entire image. Source data are provided as a Source Data file.

