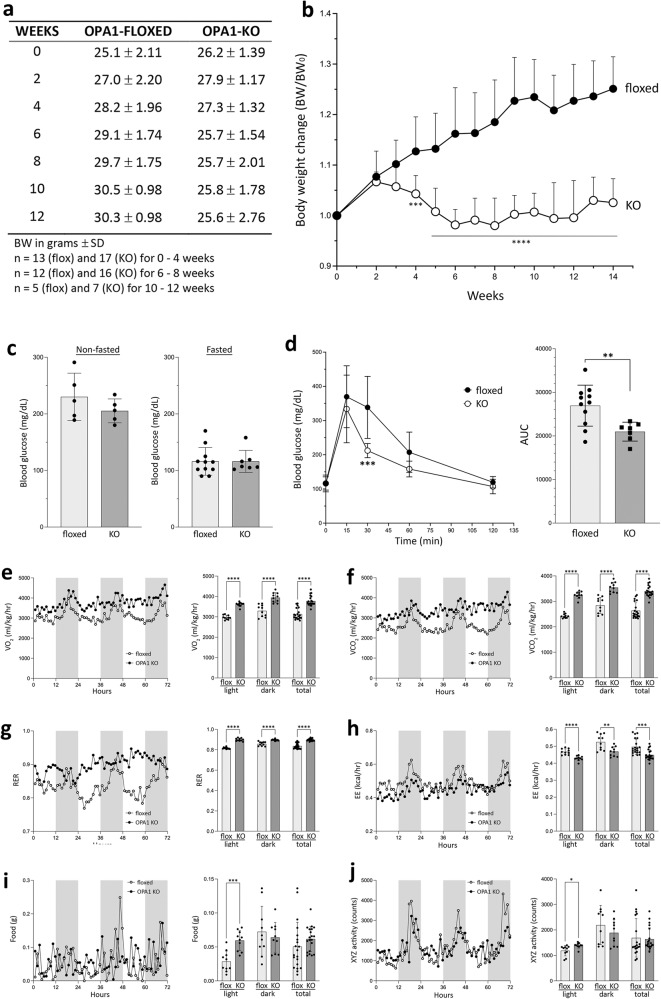
Fig. 1. OPA1 KO in the liver induces a halt in weight gain with enhanced whole body metabolism.
a Body weights (BW) of floxed and OPA1-LKO mice after AAV-Cre injection. The week 0 is the day of injection. b Weekly changes of body weights normalized to the initial weight are plotted. n = 13 (flox) and 17 (KO) animals for 0–5 weeks; n = 12 (flox) and 16 (KO) animals for 6–8 weeks; n = 6 (flox) and 8 (KO) animals for week 9; n = 5 (flox) and 7 (KO) animals for 10−14 weeks. Data are presented as mean values +/- SD. Two-way ANOVA with Sidak’s multiple comparisons. ***p = 0.0005, ****p < 0.0001. c Blood glucose measurements in non-fasted and fasted conditions. n = 5 animals per group for nonfasted; n = 10 (flox) and 7 (KO) animals for fasted. Data are presented as mean values +/- SD. Unpaired t test. d Glucose tolerance test (GTT) showing faster glucose clearance in OPA1-LKO mice. n = 11 (flox) and 7 (KO) animals. Data are presented as mean values +/- SD. Two-way ANOVA with Sidak’s multiple comparisons. ***p = 0.0001. Area under curve (AUC) shows an improved glucose clearance by OPA1 KO. Data are presented as mean values +/- SD. Unpaired t test with Welch’s correction. **p = 0.0024. e–j Assessment of metabolic parameters. n = 4 for floxed and OPA1-LKO mice. Hourly average is plotted for 72 hours. Shaded periods denote the dark cycle. Error bars are omitted. Bar graphs are the 3-day hourly average for light and dark cycles as well as total. n = 4 animals per group over 10 measures for light and dark cycles and 20 measures for total. Data are presented as mean values +/- SD. Multiple unpaired t test. The p values for light, dark, and total, respectively, are: (e) VO2, p < 0.000001, p < 0.000034, and p < 0.000001; (f) VCO2, p < 0.000001, p = 0.000013, and p < 0.000001; (g) respiratory exchange ratio; p < 0.000001, p = 0.000019, and p < 0.00001; (h) energy expenditure, p = 0.000032, p = 0.004018, and p = 0.000340; (i) food consumption, p = 0.000209, p = 0.546617, and p = 0.217867; (j) total activity, p = 0.011132, p = 0.317263, and p = 0.803317. Source data are provided as a Source Data file.

