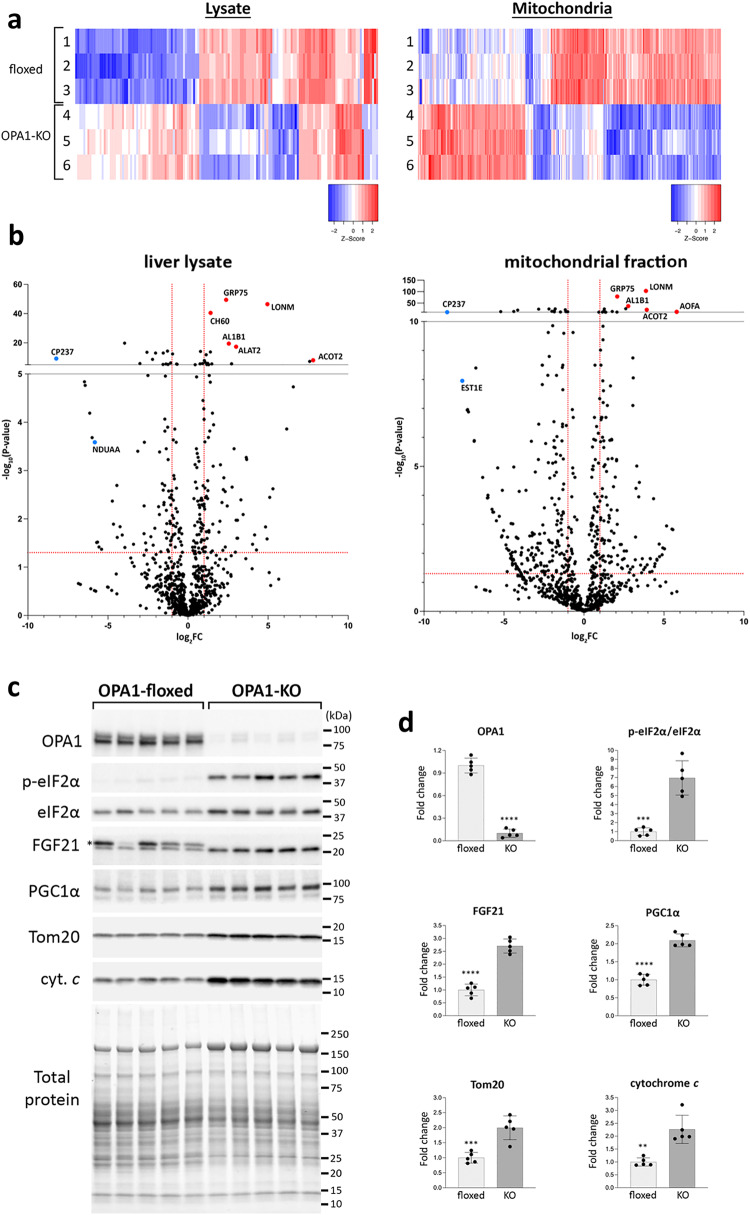
Fig. 4. OPA1 LKO alters the liver proteome by the ISR.
a The protein heatmaps for >2-fold changes in PSM scores in the lysate and mitochondrial fraction from floxed (1–3) and OPA1-KO (4–6) livers. Protein IDs are omitted. b Volcano plots of proteins identified by mass spectrometry. Red dashed lines are the cut-offs for significance: FC > 2 in X axis, and p < 0.05 in Y axis. GRP75, mitochondrial stress-70 protein; LONM, mitochondrial Lon protease; CH60, mitochondrial 60 kDa heat shock protein; AL1B1, mitochondrial aldehyde dehydrogenase X; ALAT2, alanine aminotransferase 2; CP237, cytochrome P450 2C37; ACOT2, mitochondrial acyl-coenzyme A thioesterase 2; AOFA, amine oxidase [flavin-containing] A; NDUAA, mitochondrial NADH dehydrogenase [ubiquinone] 1 alpha subcomplex subunit 10; EST1E, carboxylesterase 1E. c Immunoblotting of liver lysates from control (floxed) and OPA1-KO mice. Asterisk denotes a nonspecific band. d Quantification of immunoblots. n = 5 animals per group. Data are presented as mean values +/- SD. Unpaired t test. ****p < 0.0001; ***p = 0.0001 (p-eIF2α) and p = 0.0009 (Tom20); **p = 0.0011. Source data are provided as a Source Data file.

