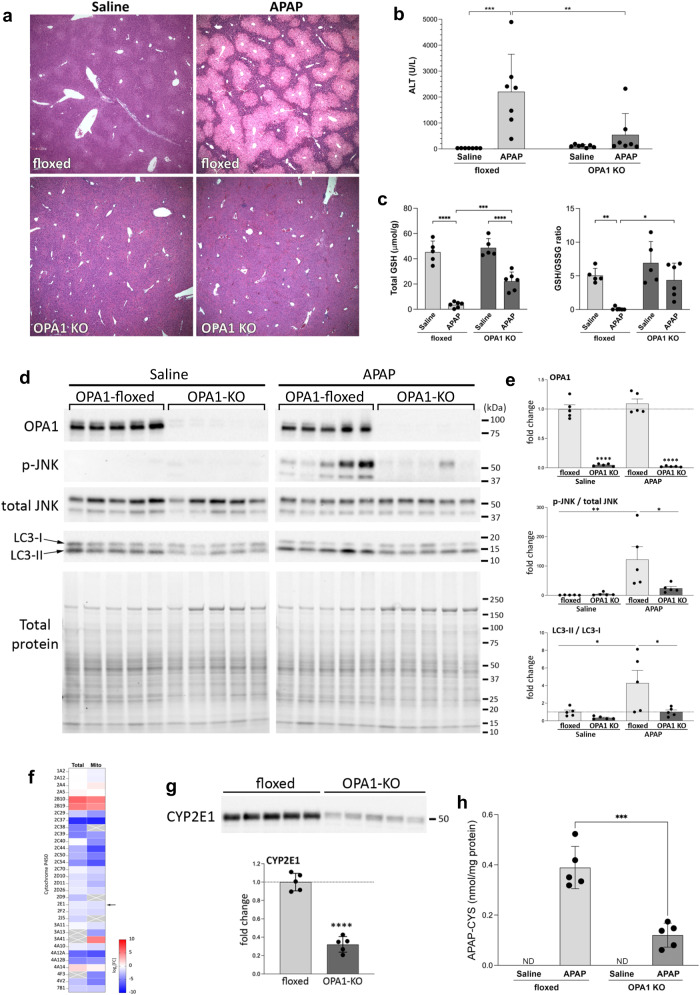
Fig. 7. OPA1-KO livers are protected from APAP-induced injury.
a H&E staining of liver sections from control and OPA1-KO mice with and without APAP. Representative images from at least 7 animals per group. The results were consistent. b, c OPA1 KO mitigates the ALT increase and GSH depletion in APAP treatment. n = 7 (b, ALT), 5 (saline in c) and 6 (APAP in c) animals. Data are presented as mean values +/- SD. Two-way ANOVA with Turkey’s multiple comparisons. ***p = 0.0003; **p = 0.0054 (b). ****p < 0.0001; ***p = 0.0007; **p = 0.0046; *p = 0.0102 (c). d, e Immunoblots for p-JNK and LC3 in floxed and OPA1-KO livers with and without APAP. n = 5 animals per group. Data are presented as mean values +/- SD. Two-way ANOVA with Turkey’s multiple comparisons. ****p < 0.0001 (OPA1); **p = 0.0066 (p-JNK); *p = 0.0291 (p-JNK), 0.0281 (LC3), and 0.0284 (LC3). f A heatmap of CYPs found in total and mitochondrial proteomes. Arrow: CYP2E1. g CYP2E1 immunoblot. Total protein is shown in Fig. 9i. n = 5 animals per group. Data are presented as mean values +/- SD. Unpaired t test. p < 0.0001. h Quantification of liver APAP-CYS; n = 5 animals per group. Data are presented as mean values +/- SD. Unpaired t test. p = 0.0003. Source data are provided as a Source Data file.

