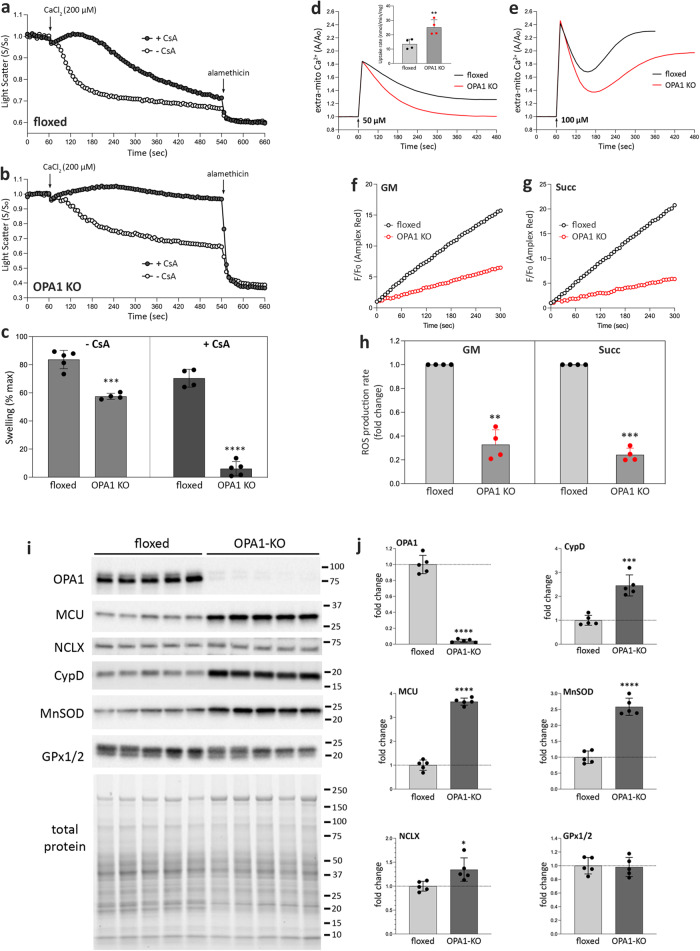
Fig. 9. OPA1 KO increases the resistance to MPT and lowers mitochondrial ROS production.
a–c Mitochondrial swelling by light scattering assays. Swelling profiles of control (a) and OPA1-KO (b) mitochondria with and without CsA, and quantification (c). n = 4 animals per group. Data are presented as mean values +/- SD. Unpaired t test. ***p = 0.0001; ****p < 0.0001. d, e Mitochondrial Ca2+ uptake profiles with 50 μM (d) and 100 μM (e) CaCl2 added to the mitochondrial suspension. The inset in (d) is the calculated Ca2+ uptake rate (nmol/min/mg mito). n = 4 animals per group. Data are presented as mean values +/- SD. Paired t test. **p = 0.0036. f–h Mitochondrial ROS production with glutamate/malate (f, GM) and succinate (g) as substrate, and quantification (h). n = 4 animals per group. Data are presented as mean values +/- SD. Paired t test. **p = 0.0017; ***p = 0.0001. i OPA1 KO increases the levels of MCU, NCLX, CypD, and MnSOD. j Quantification of (i). n = 5 animals per group. Data are presented as mean values +/- SD. Unpaired t test. ****p < 0.0001; *p = 0.0189; ***p = 0.0002. Source data are provided as a Source Data file.

