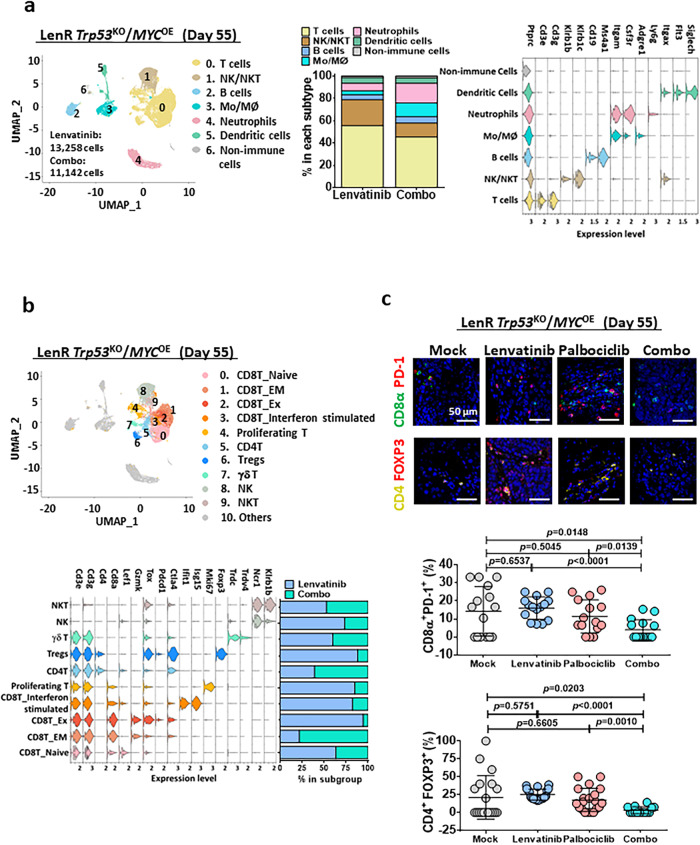
Fig. 10. The effect of palbociclib/lenvatinib treatment in modulating the tumor micro-environment in the lenvatinib-resistant Trp53KO/MYCOE immune-competent mouse model.
a Uniform manifold approximation and projection (UMAP) plot showing 7 distinct clusters resulting from scRNA sequencing of sorted CD45+ cells derived from tumors harvested from lenvatinib or combo treatment. The percentage of major immune cell types in lenvatinib or combo group was calculated. Violin plots displayed the expression of key lineage-defining genes for the major subtypes of immune cells. b UMAP visualization of T cells and NK/NKT cells only. Violin plots exhibited the expression of the key subtype-defining genes. Percentage change in each subtype was shown and combo treatment led to a decrease in CD8-expressing exhausted T and Treg cells. c Multiplex IHC staining on exhausted CD8T and Treg cells were performed using combination of CD8α (green)/PD-1 (red) (n = 15 random views) or CD4 (yellow)/FOXP3 (red) (n = 14 random views in mock, n = 20 random views in lenvatinib and palbociclib while n = 14 random views in combo) in resected tumors from lenvatinib-resistant Trp53KO/MYCOE (two-tailed t test). Scale bar = 50 µm. Number of positive cells was quantified using ImageJ. Data was presented as mean ± standard deviation. Source data are provided as a Source Data file.

