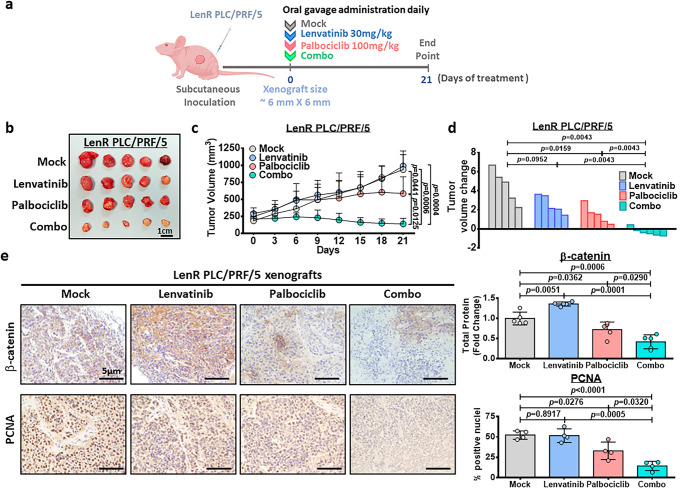
Fig. 8. The effect of palbociclib/lenvatinib treatment in suppressing tumor growth in LenR HCC xenografts.
a Schematic diagram of the treatment regimen of mock (0.5% methylcellulose in saline), palbociclib (100 mg/kg), lenvatinib (30 mg/kg) and the combined treatment (combo) group. b Response of lenvatinib-resistant PLC/PRF/5 xenografts to treatment with lenvatinib (30 mg/kg daily), palbociclib (100 mg/kg daily), or their combination through oral administration. Harvested tumors are shown. Scale bar = 1 cm. Five representative tumors in each group were shown. c Tumor growth curve showing the response towards each treatment (n = 5 mice in mock, lenvatinib and palbociclib while n = 6 mice for combo; two-tailed t test). d Waterfall plot showing the response of each tumor after 21 days (two-tailed Mann–Whitney U test). e Immunohistochemical images of β-catenin (n = 5) and PCNA (n = 4) in resected tumors (two-tailed t test). Scale bar = 5 µm. Protein signal intensity and number of positive nuclei was quantified using ImageJ software. Data was presented as mean ± standard deviation. Source data are provided as a Source Data file.

