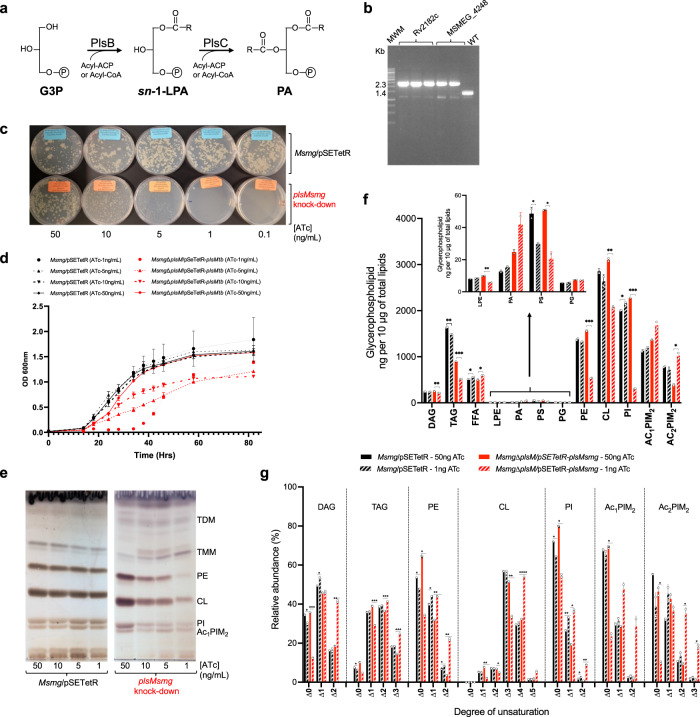
Fig. 1. plsM silencing in M. smegmatis abolishes phospholipid synthesis and leads to growth arrest.
a The PlsB/PlsC pathway to PA formation in E. coli. The PlsB-catalyzed transfer of a fatty acid to position sn-1 of G3P from acyl-ACP or acyl-CoA precedes the acylation of position sn-2 of sn-1-lysoPA by PlsC. b Allelic replacement at the plsM locus of Msmg mutants rescued with the plsM orthologs of Msmg (MSMEG_4248) and Mtb (Rv2182c) expressed from replicative pSETetR plasmids under control of an ATc-inducible (TET-ON) promoter was confirmed by PCR in two to three independent clones. The WT 1,394-bp amplification signal is replaced by a 2,312-bp fragment in the mutants due to the insertion of a 1.2 kb- kanamycin resistance cassette between the PstI and NruI restriction sites of MSMEG_4248. c Growth of the MsmgΔplsM/pSETetR-plsMtb conditional knock-down (red symbols) and Msmg/pSETetR control strain (black symbols) on 7H11-OADC plates and in, d, 7H9-ADC-tyloxapol at 37 °C in the presence of different concentrations of ATc. Shown in (d) are the means +/- SD of triplicate cultures (n = 3 biologically independent samples). Growth is totally inhibited in liquid culture in the conditional mutant at 1 ng/mL ATc until ATc regulation is lost (~40 h post-inoculation) and the strain starts replicating at a comparable rate to the control strain. e The phospholipid content of Msmg control and MsmgΔplsM/pSETetR-plsMtb cells grown on 7H11-OADC agar plates as shown in (c) were analyzed by TLC in the solvent system CHCl3:CH3OH:H2O (65:25:4 by vol.). The cells were collected on the same day and ~50 μg of total lipids were loaded per lane. f Lipids from Msmg control and MsmgΔplsM/pSETetR-plsMsmg duplicate cultures grown under permissive (50 ng/mL ATc) and non-permissive (1 ng/mL ATc) conditions in 7H9-OADC-tyloxapol at 37 °C to the same OD600 (~0.5–0.6) were quantitatively analyzed by LC/MS as described under Methods and the abundance of glycerolipids in the two strains under both culture conditions is shown as means ± SD of n = 2 biologically independent samples. g Relative abundance (in percentages) of saturated and unsaturated species within each glycerolipid category (DAG, TAG, PE, CL, PI, Ac1PIM2 and Ac2PIM2) in the same Msmg/pSETetR and MsmgΔplsM/pSETetR-plsMsmg strains grown under permissive (50 ng/mL ATc) and non-permissive (1 ng/mL ATc) conditions as in (f). Results are shown as means ± SD of n = 2 biologically independent samples. In panels (f, g) asterisks denote statistically significant differences between culture conditions pursuant to the two-sided unpaired Student’s t-test (f *p < 0.05, **p < 0.005, ***p < 0.0005; g *p < 0.01, **p < 0.001, ***p < 0.0001). The results presented in (c–g) are representative of two to three independent experiments. CL cardiolipin, DAG diglycerides, FFA free fatty acids, G3P glycerol-3-phosphate, sn-1-LPA sn-1-lysophosphatidic acid, LPE lysophosphatidylethanolamine, PA phosphatidic acid, PE phosphatidylethanolamine, PG phosphatidylglycerol, PI phosphatidyl-myo-inositol, PS phosphatidylserine, Ac1PIM2 triacylated forms of phosphatidyl-myo-inositol dimannosides, Ac2PIM2 tetraacylated forms of phosphatidyl-myo-inositol dimannosides, TMM trehalose monomycolates, TDM trehalose dimycolates. Source data for panels (d, f, g) are provided as a Source Data file.

