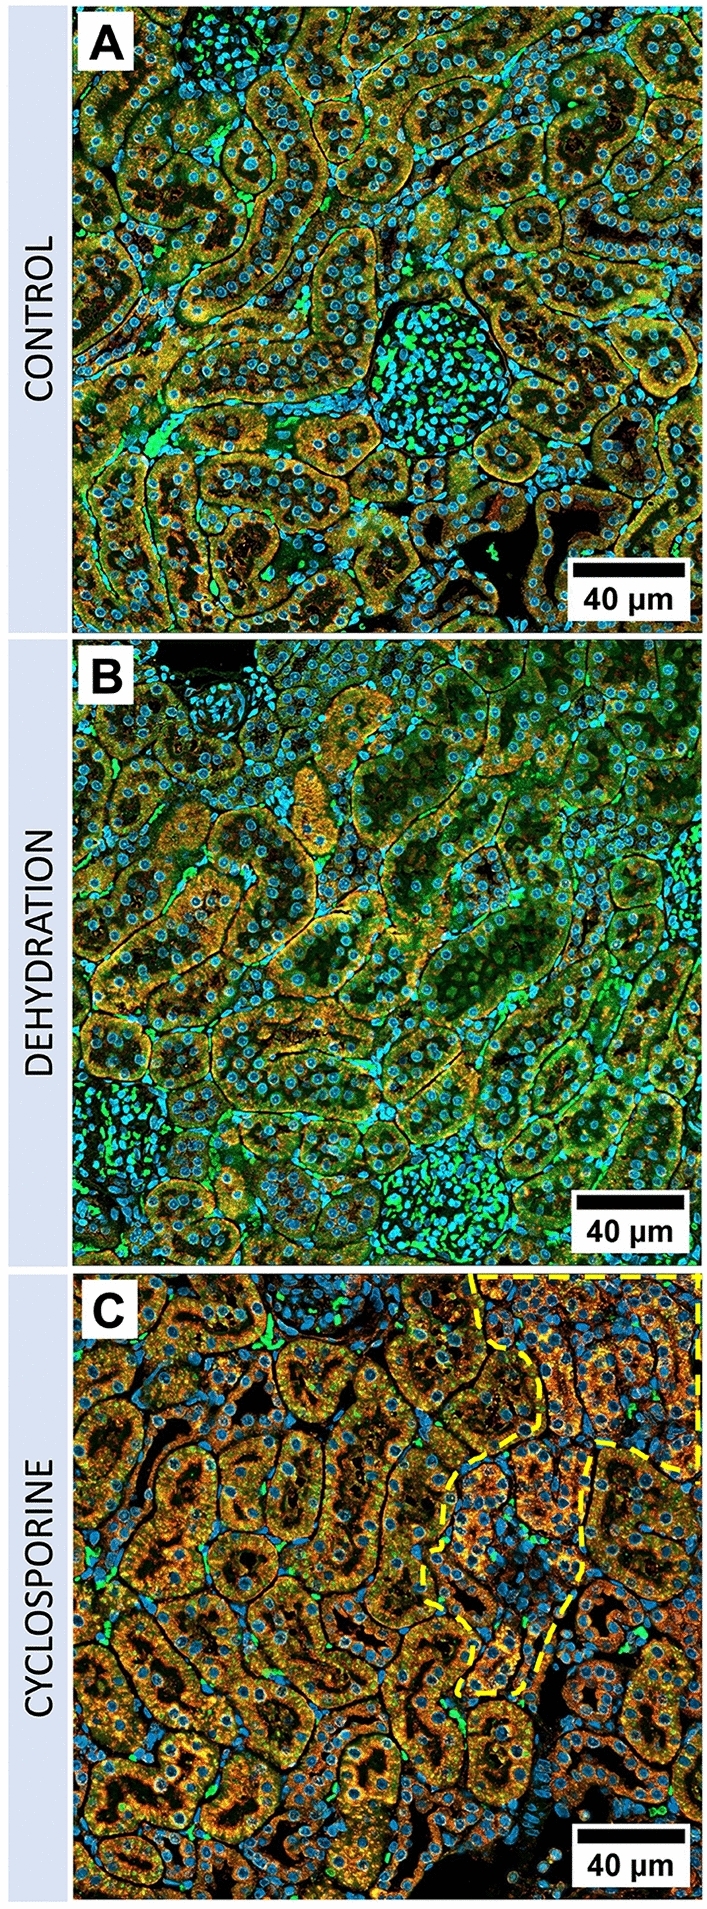
Figure 5.

Immunofluorescence microscopy of control, dehydrated, and cyclosporine-administrated renal tissue. Fluorescence microscopy of red/yellow-stained lysosomal-associated membrane protein 1 (LAMP 1) demonstrating the increase of perinuclear lysosomal staining in proximal tubules of cyclosporine-administrated animals (C) as compared to control (A) and dehydrated (B) animals. Blue represents Hoechst-stained nuclei, green is emitted renal tissue autofluorescence. Affected atrophic PTCs with an increased lysosomal load are marked within the yellow dotted line.
