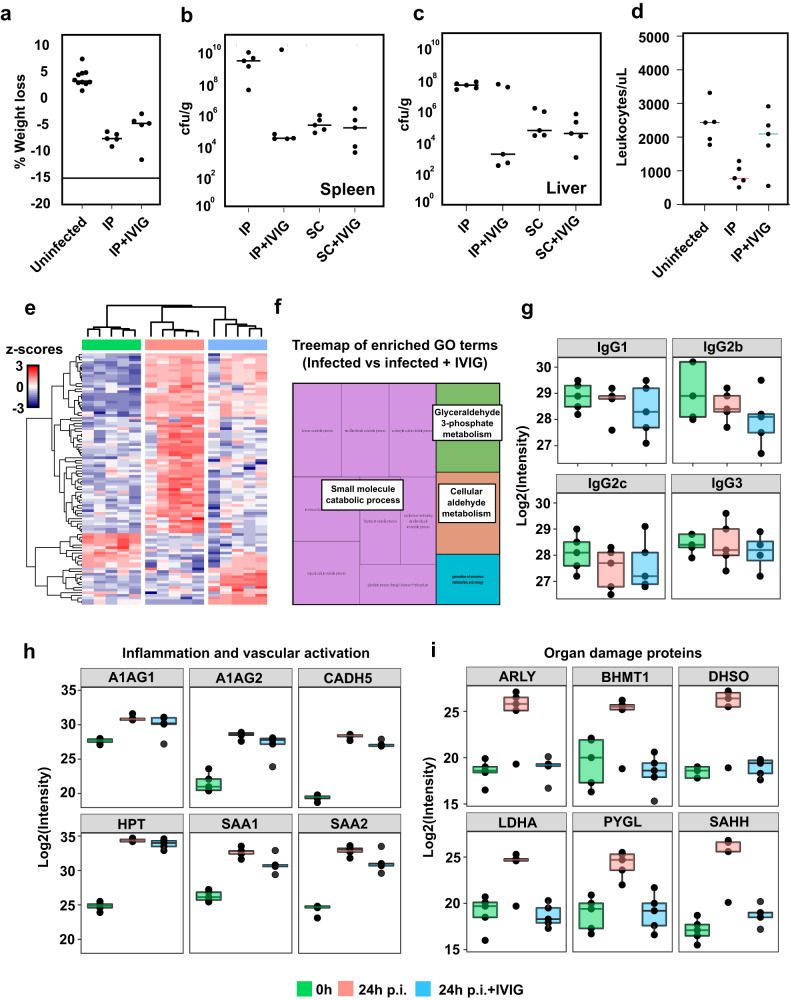
Fig. 6. Murine GAS infection and IVIG therapeutic efficacy is modulated by route of infection.
a Weight measurements of uninfected (n = 10) and intraperitoneal (IP) infected mice at 24 h p.i. with or without IVIG pretreatment (6 h before infection) (n = 5 mice/condition). b Splenic and (c) hepatic bacterial burden in IP vs subcutaneous (SC) infection models and IVIG treatment effects. d Stabilizing effect of IVIG in leukocyte counts. e Hierarchical clustering of plasma proteins significantly altered by IVIGs in IP infected mice. Colors on the top indicate treatment group as shown in the legend at the bottom. f TreeMap representation of functional enrichment analysis of plasma proteins differentially regulated by IVIG treatment. Size of the squares is proportional to degree of enrichment for the highlighted pathways. g Mass spectrometric quantification of murine IgG subclasses in the plasma samples. h Quantitative analysis of representative plasma proteins involved in inflammation and vascular activation. i Quantitative analysis of representative metabolic proteins leaking out to plasma due to organ damage. (n = 5 mice/condition). Upper whisker extends from the hinge to the largest value no further than 1.5 * IQR from the hinge (where IQR is the inter-quartile range). The lower whisker extends from the hinge to the smallest value, at most 1.5 * IQR of the hinge. Statistical significance was assessed by analysis of variance (ANOVA) with a permutation-based false discovery rate (FDR) for multiple test correction. Source data are provided as a Source Data file.

