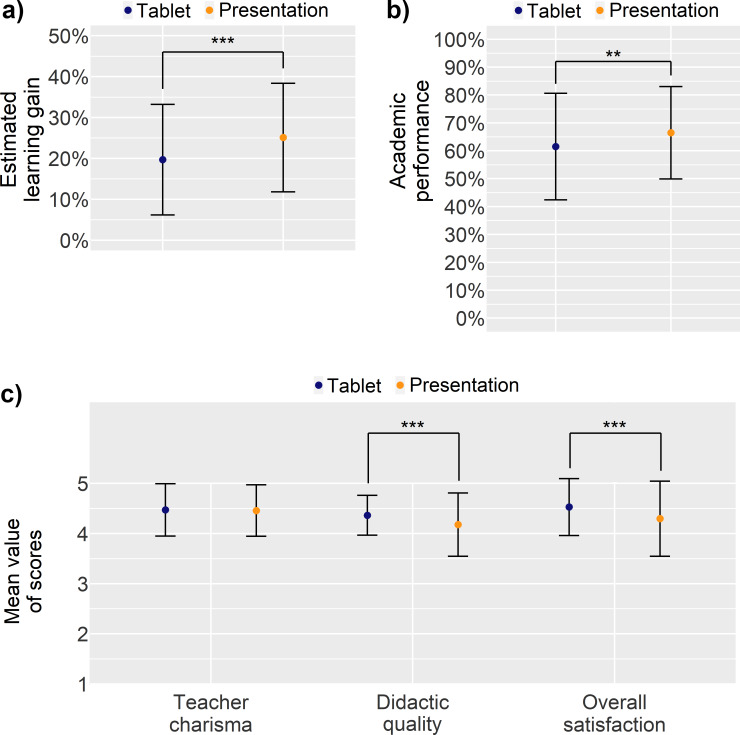
Figure 1. Plots of means and error bars of estimated learning gain (a), academic performance (b) and teacher charisma, didactic quality, and student’s overall satisfaction (c) for the tablet-based and the presentation-based seminars.
Error bars indicate ± standard deviation. Horizontal bars indicate significance between groups and effect size; **p<0.01, ***p<0.001. As student digital affinity was assessed independently of the seminar format, it is not depicted in this figure. Please note that estimated learning gain, teacher charisma, and academic performance were only assessed in the winter term of 2019/20.

